Japanese vs Immigrants from Uganda Unemployment Among Ages 25 to 29 years
COMPARE
Japanese
Immigrants from Uganda
Unemployment Among Ages 25 to 29 years
Unemployment Among Ages 25 to 29 years Comparison
Japanese
Immigrants from Uganda
6.9%
UNEMPLOYMENT AMONG AGES 25 TO 29 YEARS
5.4/ 100
METRIC RATING
225th/ 347
METRIC RANK
6.5%
UNEMPLOYMENT AMONG AGES 25 TO 29 YEARS
84.5/ 100
METRIC RATING
121st/ 347
METRIC RANK
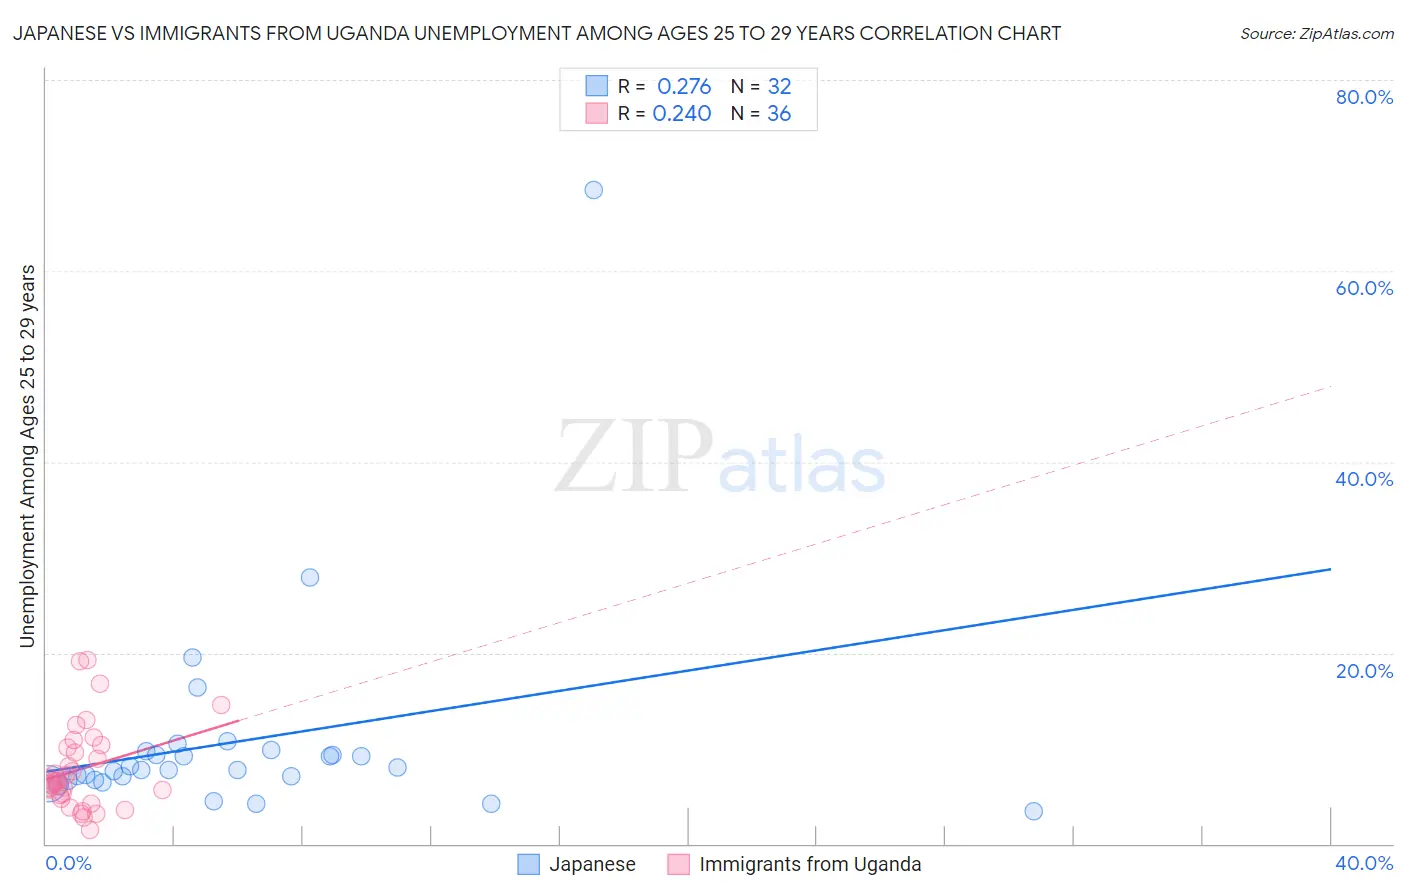
Japanese vs Immigrants from Uganda Unemployment Among Ages 25 to 29 years Correlation Chart
The statistical analysis conducted on geographies consisting of 243,883,894 people shows a weak positive correlation between the proportion of Japanese and unemployment rate among population between the ages 25 and 29 in the United States with a correlation coefficient (R) of 0.276 and weighted average of 6.9%. Similarly, the statistical analysis conducted on geographies consisting of 124,236,275 people shows a weak positive correlation between the proportion of Immigrants from Uganda and unemployment rate among population between the ages 25 and 29 in the United States with a correlation coefficient (R) of 0.240 and weighted average of 6.5%, a difference of 7.2%.
Unemployment Among Ages 25 to 29 years Correlation Summary
| Measurement | Japanese | Immigrants from Uganda |
| Minimum | 3.4% | 1.5% |
| Maximum | 68.5% | 19.3% |
| Range | 65.1% | 17.8% |
| Mean | 10.7% | 7.8% |
| Median | 7.8% | 6.5% |
| Interquartile 25% (IQ1) | 6.7% | 4.9% |
| Interquartile 75% (IQ3) | 9.5% | 10.2% |
| Interquartile Range (IQR) | 2.9% | 5.3% |
| Standard Deviation (Sample) | 11.5% | 4.4% |
| Standard Deviation (Population) | 11.4% | 4.4% |
Similar Demographics by Unemployment Among Ages 25 to 29 years
Demographics Similar to Japanese by Unemployment Among Ages 25 to 29 years
In terms of unemployment among ages 25 to 29 years, the demographic groups most similar to Japanese are Immigrants from Liberia (7.0%, a difference of 0.19%), Immigrants (6.9%, a difference of 0.22%), Salvadoran (7.0%, a difference of 0.32%), Immigrants from Panama (7.0%, a difference of 0.38%), and Bermudan (7.0%, a difference of 0.53%).
| Demographics | Rating | Rank | Unemployment Among Ages 25 to 29 years |
| Immigrants | Austria | 12.3 /100 | #218 | Poor 6.8% |
| Whites/Caucasians | 10.6 /100 | #219 | Poor 6.9% |
| French | 10.5 /100 | #220 | Poor 6.9% |
| Israelis | 9.8 /100 | #221 | Tragic 6.9% |
| Spaniards | 7.7 /100 | #222 | Tragic 6.9% |
| Celtics | 7.6 /100 | #223 | Tragic 6.9% |
| Immigrants | Immigrants | 6.2 /100 | #224 | Tragic 6.9% |
| Japanese | 5.4 /100 | #225 | Tragic 6.9% |
| Immigrants | Liberia | 4.8 /100 | #226 | Tragic 7.0% |
| Salvadorans | 4.4 /100 | #227 | Tragic 7.0% |
| Immigrants | Panama | 4.2 /100 | #228 | Tragic 7.0% |
| Bermudans | 3.8 /100 | #229 | Tragic 7.0% |
| Immigrants | El Salvador | 3.6 /100 | #230 | Tragic 7.0% |
| Central Americans | 3.0 /100 | #231 | Tragic 7.0% |
| Spanish Americans | 2.7 /100 | #232 | Tragic 7.0% |
Demographics Similar to Immigrants from Uganda by Unemployment Among Ages 25 to 29 years
In terms of unemployment among ages 25 to 29 years, the demographic groups most similar to Immigrants from Uganda are Immigrants from Moldova (6.5%, a difference of 0.0%), Immigrants from South Africa (6.5%, a difference of 0.050%), Immigrants from Belarus (6.5%, a difference of 0.090%), Chilean (6.5%, a difference of 0.10%), and Laotian (6.5%, a difference of 0.10%).
| Demographics | Rating | Rank | Unemployment Among Ages 25 to 29 years |
| Germans | 86.3 /100 | #114 | Excellent 6.5% |
| Macedonians | 86.1 /100 | #115 | Excellent 6.5% |
| Pakistanis | 85.9 /100 | #116 | Excellent 6.5% |
| Immigrants | Uruguay | 85.7 /100 | #117 | Excellent 6.5% |
| Chileans | 85.3 /100 | #118 | Excellent 6.5% |
| Immigrants | South Africa | 84.9 /100 | #119 | Excellent 6.5% |
| Immigrants | Moldova | 84.5 /100 | #120 | Excellent 6.5% |
| Immigrants | Uganda | 84.5 /100 | #121 | Excellent 6.5% |
| Immigrants | Belarus | 83.7 /100 | #122 | Excellent 6.5% |
| Laotians | 83.6 /100 | #123 | Excellent 6.5% |
| Arabs | 82.5 /100 | #124 | Excellent 6.5% |
| Syrians | 82.1 /100 | #125 | Excellent 6.5% |
| Brazilians | 81.9 /100 | #126 | Excellent 6.5% |
| Dutch | 80.6 /100 | #127 | Excellent 6.5% |
| Immigrants | Chile | 80.5 /100 | #128 | Excellent 6.5% |