Japanese vs Latvian 6th Grade
COMPARE
Japanese
Latvian
6th Grade
6th Grade Comparison
Japanese
Latvians
95.4%
6TH GRADE
0.0/ 100
METRIC RATING
316th/ 347
METRIC RANK
97.9%
6TH GRADE
99.9/ 100
METRIC RATING
40th/ 347
METRIC RANK
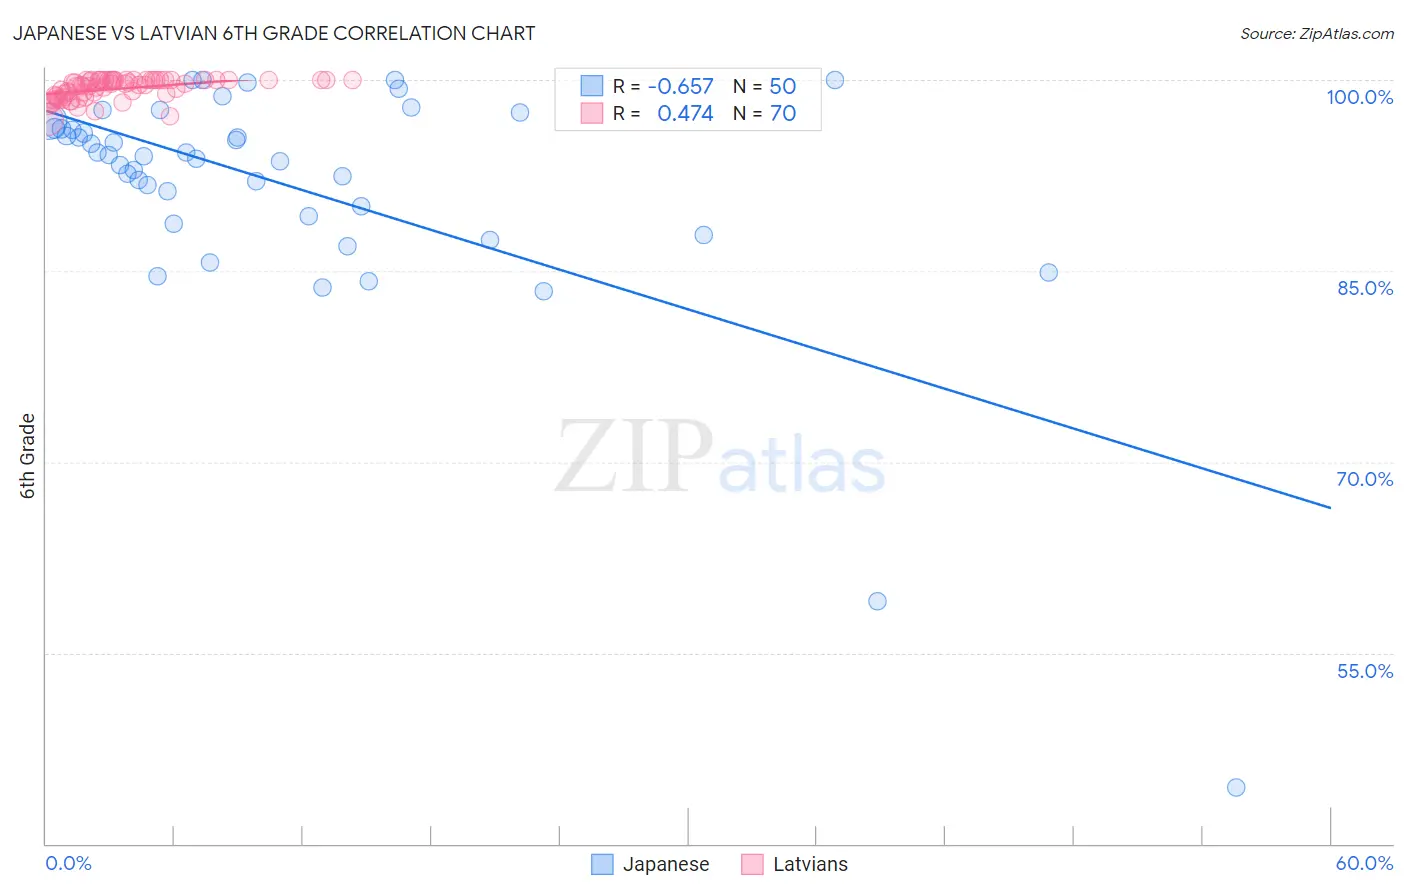
Japanese vs Latvian 6th Grade Correlation Chart
The statistical analysis conducted on geographies consisting of 249,183,224 people shows a significant negative correlation between the proportion of Japanese and percentage of population with at least 6th grade education in the United States with a correlation coefficient (R) of -0.657 and weighted average of 95.4%. Similarly, the statistical analysis conducted on geographies consisting of 220,726,452 people shows a moderate positive correlation between the proportion of Latvians and percentage of population with at least 6th grade education in the United States with a correlation coefficient (R) of 0.474 and weighted average of 97.9%, a difference of 2.6%.
6th Grade Correlation Summary
| Measurement | Japanese | Latvian |
| Minimum | 44.4% | 96.9% |
| Maximum | 100.0% | 100.0% |
| Range | 55.6% | 3.1% |
| Mean | 91.7% | 99.3% |
| Median | 94.0% | 99.6% |
| Interquartile 25% (IQ1) | 89.3% | 98.7% |
| Interquartile 75% (IQ3) | 96.2% | 100.0% |
| Interquartile Range (IQR) | 6.9% | 1.3% |
| Standard Deviation (Sample) | 9.6% | 0.79% |
| Standard Deviation (Population) | 9.5% | 0.79% |
Similar Demographics by 6th Grade
Demographics Similar to Japanese by 6th Grade
In terms of 6th grade, the demographic groups most similar to Japanese are Immigrants from Bangladesh (95.4%, a difference of 0.010%), Immigrants from Vietnam (95.4%, a difference of 0.020%), Nicaraguan (95.4%, a difference of 0.030%), Vietnamese (95.3%, a difference of 0.030%), and Belizean (95.3%, a difference of 0.060%).
| Demographics | Rating | Rank | 6th Grade |
| Puerto Ricans | 0.0 /100 | #309 | Tragic 95.5% |
| Ecuadorians | 0.0 /100 | #310 | Tragic 95.5% |
| Immigrants | Portugal | 0.0 /100 | #311 | Tragic 95.5% |
| Immigrants | Guyana | 0.0 /100 | #312 | Tragic 95.5% |
| Nicaraguans | 0.0 /100 | #313 | Tragic 95.4% |
| Immigrants | Vietnam | 0.0 /100 | #314 | Tragic 95.4% |
| Immigrants | Bangladesh | 0.0 /100 | #315 | Tragic 95.4% |
| Japanese | 0.0 /100 | #316 | Tragic 95.4% |
| Vietnamese | 0.0 /100 | #317 | Tragic 95.3% |
| Belizeans | 0.0 /100 | #318 | Tragic 95.3% |
| Immigrants | Belize | 0.0 /100 | #319 | Tragic 95.3% |
| Immigrants | Ecuador | 0.0 /100 | #320 | Tragic 95.3% |
| Immigrants | Fiji | 0.0 /100 | #321 | Tragic 95.2% |
| Immigrants | Cambodia | 0.0 /100 | #322 | Tragic 95.2% |
| Central American Indians | 0.0 /100 | #323 | Tragic 95.1% |
Demographics Similar to Latvians by 6th Grade
In terms of 6th grade, the demographic groups most similar to Latvians are Belgian (97.9%, a difference of 0.010%), Luxembourger (97.9%, a difference of 0.010%), British (97.9%, a difference of 0.030%), Eastern European (97.9%, a difference of 0.030%), and Chinese (97.9%, a difference of 0.040%).
| Demographics | Rating | Rank | 6th Grade |
| Chippewa | 100.0 /100 | #33 | Exceptional 97.9% |
| Swiss | 100.0 /100 | #34 | Exceptional 97.9% |
| Chinese | 100.0 /100 | #35 | Exceptional 97.9% |
| Italians | 100.0 /100 | #36 | Exceptional 97.9% |
| British | 100.0 /100 | #37 | Exceptional 97.9% |
| Belgians | 100.0 /100 | #38 | Exceptional 97.9% |
| Luxembourgers | 99.9 /100 | #39 | Exceptional 97.9% |
| Latvians | 99.9 /100 | #40 | Exceptional 97.9% |
| Eastern Europeans | 99.9 /100 | #41 | Exceptional 97.9% |
| Hungarians | 99.9 /100 | #42 | Exceptional 97.8% |
| Northern Europeans | 99.9 /100 | #43 | Exceptional 97.8% |
| Czechoslovakians | 99.9 /100 | #44 | Exceptional 97.8% |
| Bulgarians | 99.9 /100 | #45 | Exceptional 97.8% |
| Arapaho | 99.9 /100 | #46 | Exceptional 97.8% |
| Native Hawaiians | 99.9 /100 | #47 | Exceptional 97.8% |