Japanese vs Immigrants from Korea 6th Grade
COMPARE
Japanese
Immigrants from Korea
6th Grade
6th Grade Comparison
Japanese
Immigrants from Korea
95.4%
6TH GRADE
0.0/ 100
METRIC RATING
316th/ 347
METRIC RANK
97.1%
6TH GRADE
57.7/ 100
METRIC RATING
164th/ 347
METRIC RANK
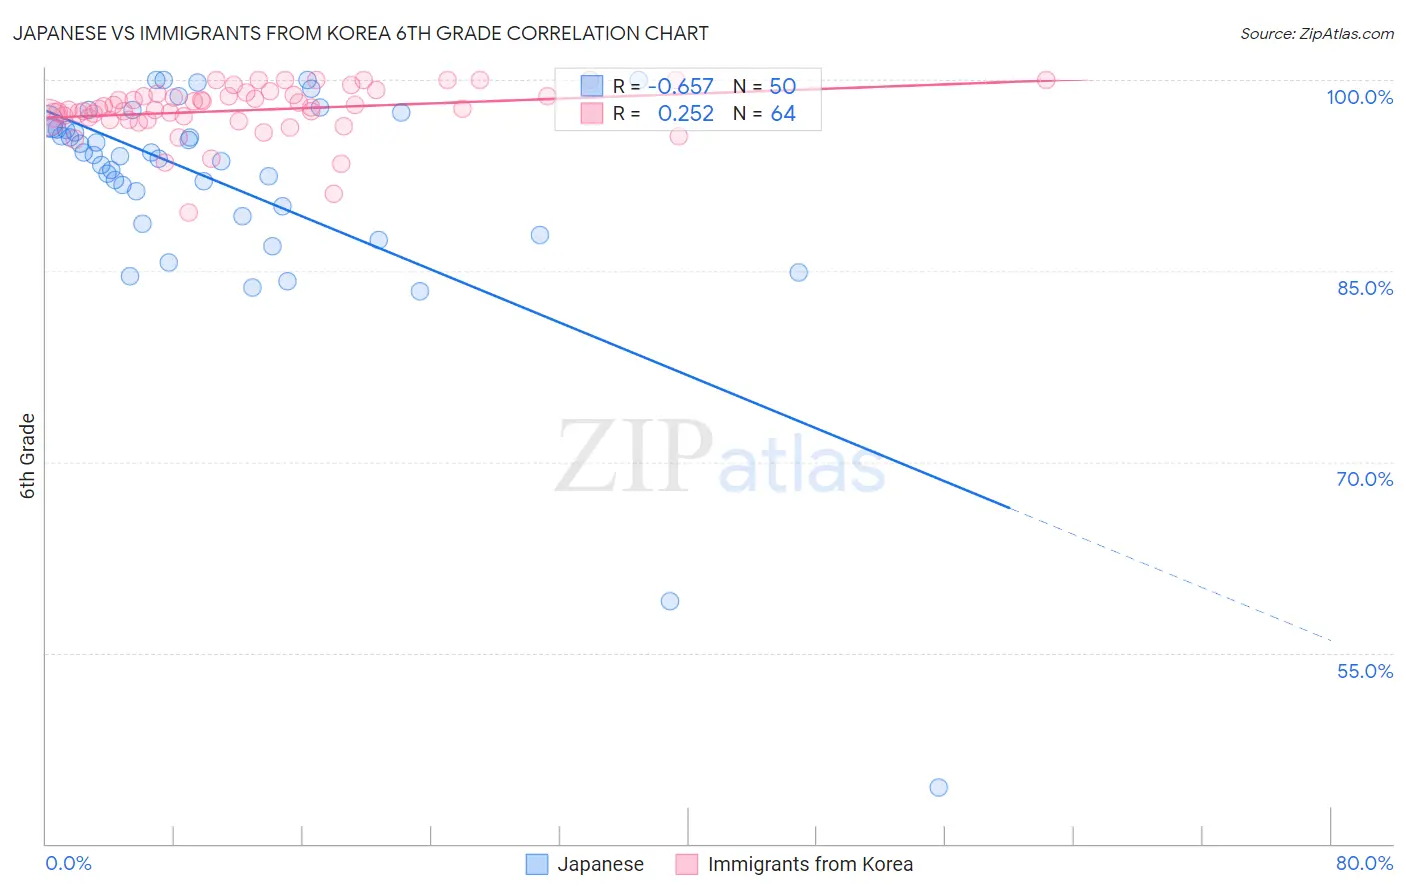
Japanese vs Immigrants from Korea 6th Grade Correlation Chart
The statistical analysis conducted on geographies consisting of 249,183,224 people shows a significant negative correlation between the proportion of Japanese and percentage of population with at least 6th grade education in the United States with a correlation coefficient (R) of -0.657 and weighted average of 95.4%. Similarly, the statistical analysis conducted on geographies consisting of 416,280,076 people shows a weak positive correlation between the proportion of Immigrants from Korea and percentage of population with at least 6th grade education in the United States with a correlation coefficient (R) of 0.252 and weighted average of 97.1%, a difference of 1.8%.
6th Grade Correlation Summary
| Measurement | Japanese | Immigrants from Korea |
| Minimum | 44.4% | 89.6% |
| Maximum | 100.0% | 100.0% |
| Range | 55.6% | 10.4% |
| Mean | 91.7% | 97.6% |
| Median | 94.0% | 97.8% |
| Interquartile 25% (IQ1) | 89.3% | 97.0% |
| Interquartile 75% (IQ3) | 96.2% | 98.9% |
| Interquartile Range (IQR) | 6.9% | 1.9% |
| Standard Deviation (Sample) | 9.6% | 2.1% |
| Standard Deviation (Population) | 9.5% | 2.0% |
Similar Demographics by 6th Grade
Demographics Similar to Japanese by 6th Grade
In terms of 6th grade, the demographic groups most similar to Japanese are Immigrants from Bangladesh (95.4%, a difference of 0.010%), Immigrants from Vietnam (95.4%, a difference of 0.020%), Nicaraguan (95.4%, a difference of 0.030%), Vietnamese (95.3%, a difference of 0.030%), and Belizean (95.3%, a difference of 0.060%).
| Demographics | Rating | Rank | 6th Grade |
| Puerto Ricans | 0.0 /100 | #309 | Tragic 95.5% |
| Ecuadorians | 0.0 /100 | #310 | Tragic 95.5% |
| Immigrants | Portugal | 0.0 /100 | #311 | Tragic 95.5% |
| Immigrants | Guyana | 0.0 /100 | #312 | Tragic 95.5% |
| Nicaraguans | 0.0 /100 | #313 | Tragic 95.4% |
| Immigrants | Vietnam | 0.0 /100 | #314 | Tragic 95.4% |
| Immigrants | Bangladesh | 0.0 /100 | #315 | Tragic 95.4% |
| Japanese | 0.0 /100 | #316 | Tragic 95.4% |
| Vietnamese | 0.0 /100 | #317 | Tragic 95.3% |
| Belizeans | 0.0 /100 | #318 | Tragic 95.3% |
| Immigrants | Belize | 0.0 /100 | #319 | Tragic 95.3% |
| Immigrants | Ecuador | 0.0 /100 | #320 | Tragic 95.3% |
| Immigrants | Fiji | 0.0 /100 | #321 | Tragic 95.2% |
| Immigrants | Cambodia | 0.0 /100 | #322 | Tragic 95.2% |
| Central American Indians | 0.0 /100 | #323 | Tragic 95.1% |
Demographics Similar to Immigrants from Korea by 6th Grade
In terms of 6th grade, the demographic groups most similar to Immigrants from Korea are Albanian (97.1%, a difference of 0.0%), Immigrants from Belarus (97.1%, a difference of 0.010%), Marshallese (97.1%, a difference of 0.010%), Immigrants from Poland (97.1%, a difference of 0.010%), and Kenyan (97.1%, a difference of 0.020%).
| Demographics | Rating | Rank | 6th Grade |
| Immigrants | Russia | 67.6 /100 | #157 | Good 97.1% |
| Immigrants | Iran | 63.3 /100 | #158 | Good 97.1% |
| Kenyans | 62.9 /100 | #159 | Good 97.1% |
| Ugandans | 62.2 /100 | #160 | Good 97.1% |
| Immigrants | Belarus | 60.4 /100 | #161 | Good 97.1% |
| Marshallese | 60.2 /100 | #162 | Good 97.1% |
| Albanians | 57.8 /100 | #163 | Average 97.1% |
| Immigrants | Korea | 57.7 /100 | #164 | Average 97.1% |
| Immigrants | Poland | 56.2 /100 | #165 | Average 97.1% |
| Immigrants | Italy | 53.8 /100 | #166 | Average 97.1% |
| Apache | 53.6 /100 | #167 | Average 97.1% |
| Immigrants | Taiwan | 53.5 /100 | #168 | Average 97.1% |
| Bermudans | 52.6 /100 | #169 | Average 97.1% |
| Chileans | 52.1 /100 | #170 | Average 97.1% |
| Immigrants | Sri Lanka | 51.7 /100 | #171 | Average 97.1% |