South African vs Immigrants from Germany GED/Equivalency
COMPARE
South African
Immigrants from Germany
GED/Equivalency
GED/Equivalency Comparison
South Africans
Immigrants from Germany
87.5%
GED/EQUIVALENCY
98.3/ 100
METRIC RATING
83rd/ 347
METRIC RANK
86.7%
GED/EQUIVALENCY
88.8/ 100
METRIC RATING
130th/ 347
METRIC RANK
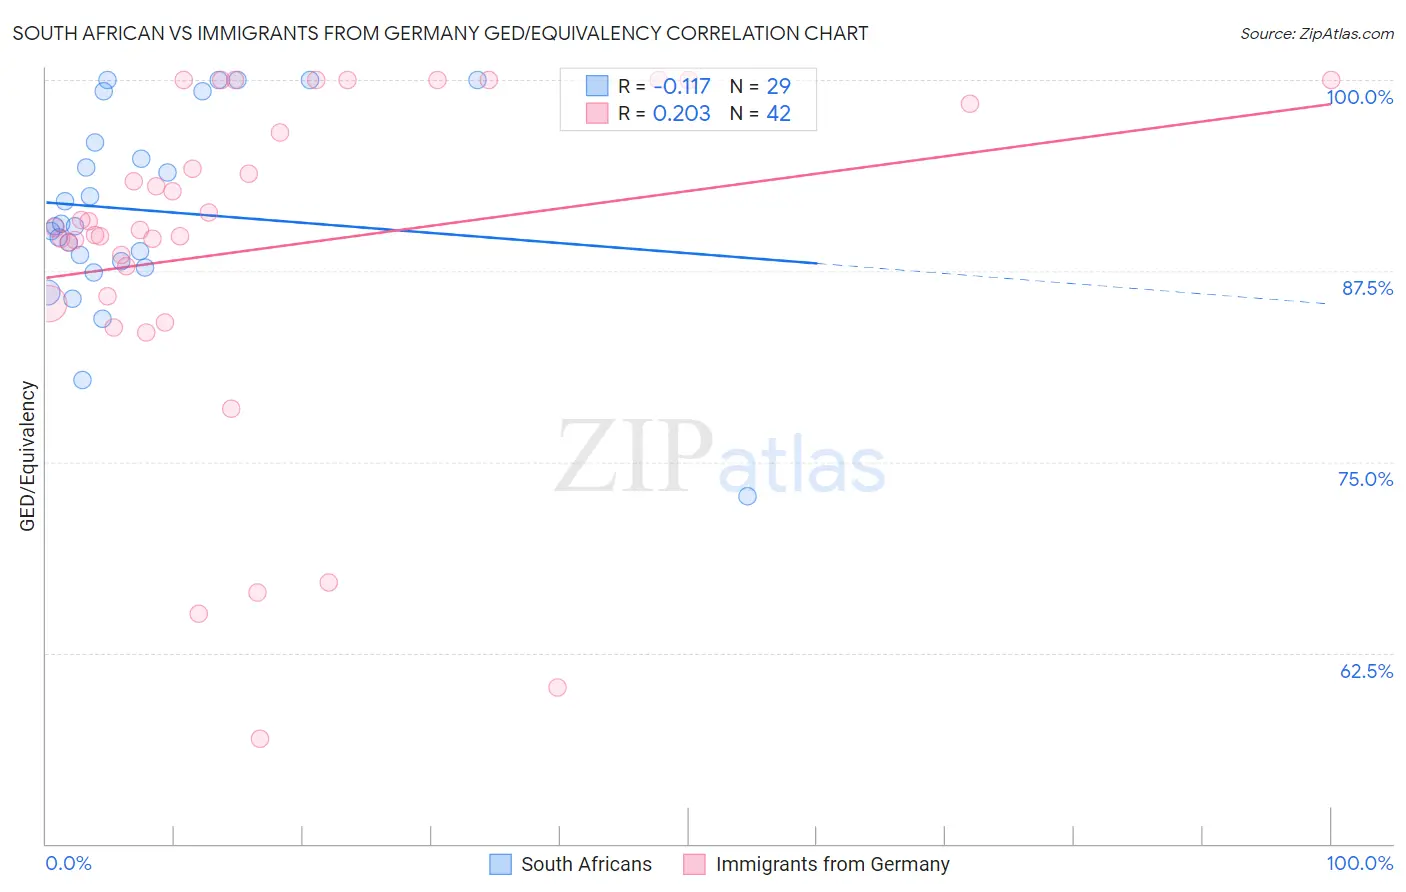
South African vs Immigrants from Germany GED/Equivalency Correlation Chart
The statistical analysis conducted on geographies consisting of 182,604,532 people shows a poor negative correlation between the proportion of South Africans and percentage of population with at least ged/equivalency education in the United States with a correlation coefficient (R) of -0.117 and weighted average of 87.5%. Similarly, the statistical analysis conducted on geographies consisting of 463,886,920 people shows a weak positive correlation between the proportion of Immigrants from Germany and percentage of population with at least ged/equivalency education in the United States with a correlation coefficient (R) of 0.203 and weighted average of 86.7%, a difference of 1.0%.
GED/Equivalency Correlation Summary
| Measurement | South African | Immigrants from Germany |
| Minimum | 72.7% | 56.9% |
| Maximum | 100.0% | 100.0% |
| Range | 27.3% | 43.1% |
| Mean | 91.5% | 89.0% |
| Median | 90.4% | 90.3% |
| Interquartile 25% (IQ1) | 87.9% | 85.9% |
| Interquartile 75% (IQ3) | 97.6% | 98.4% |
| Interquartile Range (IQR) | 9.7% | 12.6% |
| Standard Deviation (Sample) | 6.5% | 11.2% |
| Standard Deviation (Population) | 6.4% | 11.0% |
Similar Demographics by GED/Equivalency
Demographics Similar to South Africans by GED/Equivalency
In terms of ged/equivalency, the demographic groups most similar to South Africans are Immigrants from Sri Lanka (87.5%, a difference of 0.010%), Romanian (87.5%, a difference of 0.010%), Immigrants from Romania (87.5%, a difference of 0.040%), Dutch (87.5%, a difference of 0.040%), and Immigrants from England (87.6%, a difference of 0.050%).
| Demographics | Rating | Rank | GED/Equivalency |
| Immigrants | Serbia | 98.7 /100 | #76 | Exceptional 87.7% |
| Slavs | 98.7 /100 | #77 | Exceptional 87.7% |
| Irish | 98.6 /100 | #78 | Exceptional 87.6% |
| English | 98.6 /100 | #79 | Exceptional 87.6% |
| Immigrants | England | 98.5 /100 | #80 | Exceptional 87.6% |
| Immigrants | Sri Lanka | 98.3 /100 | #81 | Exceptional 87.5% |
| Romanians | 98.3 /100 | #82 | Exceptional 87.5% |
| South Africans | 98.3 /100 | #83 | Exceptional 87.5% |
| Immigrants | Romania | 98.1 /100 | #84 | Exceptional 87.5% |
| Dutch | 98.1 /100 | #85 | Exceptional 87.5% |
| Immigrants | Europe | 98.1 /100 | #86 | Exceptional 87.5% |
| Native Hawaiians | 98.1 /100 | #87 | Exceptional 87.5% |
| Immigrants | Norway | 98.1 /100 | #88 | Exceptional 87.5% |
| Hungarians | 97.9 /100 | #89 | Exceptional 87.4% |
| Welsh | 97.9 /100 | #90 | Exceptional 87.4% |
Demographics Similar to Immigrants from Germany by GED/Equivalency
In terms of ged/equivalency, the demographic groups most similar to Immigrants from Germany are Immigrants from Ukraine (86.7%, a difference of 0.0%), Immigrants from Spain (86.7%, a difference of 0.020%), Immigrants from Brazil (86.6%, a difference of 0.020%), Yugoslavian (86.7%, a difference of 0.030%), and Tsimshian (86.6%, a difference of 0.030%).
| Demographics | Rating | Rank | GED/Equivalency |
| Immigrants | Italy | 90.5 /100 | #123 | Exceptional 86.7% |
| Immigrants | Egypt | 90.4 /100 | #124 | Exceptional 86.7% |
| Celtics | 90.4 /100 | #125 | Exceptional 86.7% |
| Asians | 90.3 /100 | #126 | Exceptional 86.7% |
| Argentineans | 89.7 /100 | #127 | Excellent 86.7% |
| Yugoslavians | 89.5 /100 | #128 | Excellent 86.7% |
| Immigrants | Ukraine | 88.9 /100 | #129 | Excellent 86.7% |
| Immigrants | Germany | 88.8 /100 | #130 | Excellent 86.7% |
| Immigrants | Spain | 88.5 /100 | #131 | Excellent 86.7% |
| Immigrants | Brazil | 88.4 /100 | #132 | Excellent 86.6% |
| Tsimshian | 88.3 /100 | #133 | Excellent 86.6% |
| Albanians | 87.7 /100 | #134 | Excellent 86.6% |
| Immigrants | Asia | 87.4 /100 | #135 | Excellent 86.6% |
| Chileans | 86.9 /100 | #136 | Excellent 86.6% |
| Arabs | 86.7 /100 | #137 | Excellent 86.6% |