Japanese vs Dominican Disability Age Over 75
COMPARE
Japanese
Dominican
Disability Age Over 75
Disability Age Over 75 Comparison
Japanese
Dominicans
50.2%
DISABILITY AGE OVER 75
0.0/ 100
METRIC RATING
303rd/ 347
METRIC RANK
50.2%
DISABILITY AGE OVER 75
0.0/ 100
METRIC RATING
301st/ 347
METRIC RANK
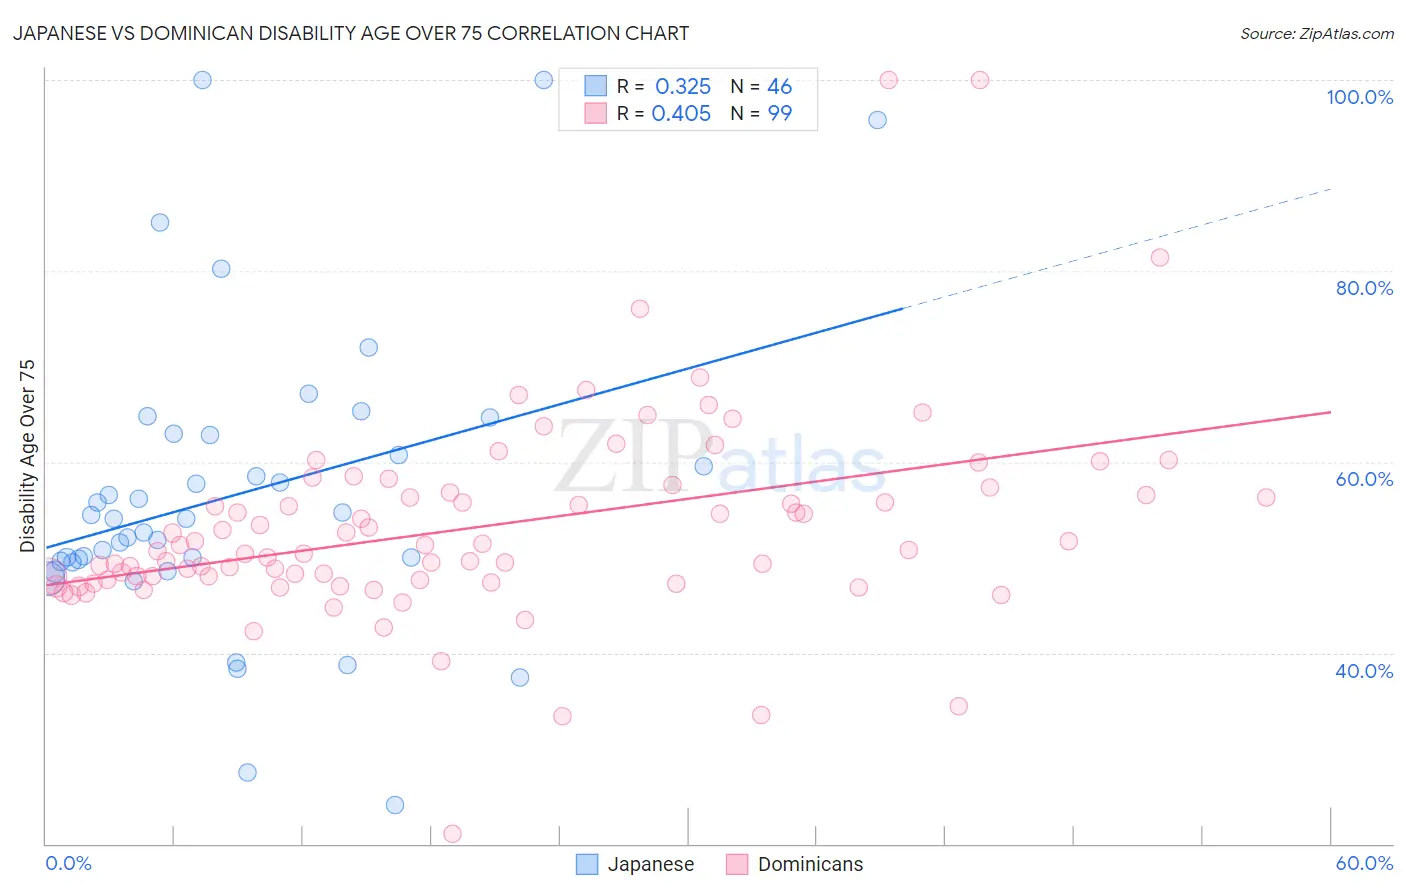
Japanese vs Dominican Disability Age Over 75 Correlation Chart
The statistical analysis conducted on geographies consisting of 248,861,887 people shows a mild positive correlation between the proportion of Japanese and percentage of population with a disability over the age of 75 in the United States with a correlation coefficient (R) of 0.325 and weighted average of 50.2%. Similarly, the statistical analysis conducted on geographies consisting of 354,096,183 people shows a moderate positive correlation between the proportion of Dominicans and percentage of population with a disability over the age of 75 in the United States with a correlation coefficient (R) of 0.405 and weighted average of 50.2%, a difference of 0.17%.
Disability Age Over 75 Correlation Summary
| Measurement | Japanese | Dominican |
| Minimum | 24.0% | 21.0% |
| Maximum | 100.0% | 100.0% |
| Range | 76.0% | 79.0% |
| Mean | 56.6% | 53.2% |
| Median | 54.0% | 50.8% |
| Interquartile 25% (IQ1) | 49.6% | 47.6% |
| Interquartile 75% (IQ3) | 62.8% | 56.8% |
| Interquartile Range (IQR) | 13.3% | 9.2% |
| Standard Deviation (Sample) | 15.9% | 10.8% |
| Standard Deviation (Population) | 15.7% | 10.8% |
Demographics Similar to Japanese and Dominicans by Disability Age Over 75
In terms of disability age over 75, the demographic groups most similar to Japanese are Cherokee (50.2%, a difference of 0.010%), Immigrants from Dominican Republic (50.3%, a difference of 0.11%), Cape Verdean (50.1%, a difference of 0.23%), Immigrants from Micronesia (50.1%, a difference of 0.26%), and Marshallese (50.1%, a difference of 0.33%). Similarly, the demographic groups most similar to Dominicans are Cape Verdean (50.1%, a difference of 0.060%), Immigrants from Micronesia (50.1%, a difference of 0.090%), Cherokee (50.2%, a difference of 0.15%), Marshallese (50.1%, a difference of 0.16%), and Armenian (50.0%, a difference of 0.22%).
| Demographics | Rating | Rank | Disability Age Over 75 |
| Shoshone | 0.0 /100 | #292 | Tragic 49.9% |
| Spanish American Indians | 0.0 /100 | #293 | Tragic 49.9% |
| Immigrants | Cambodia | 0.0 /100 | #294 | Tragic 50.0% |
| Spanish Americans | 0.0 /100 | #295 | Tragic 50.0% |
| Mexican American Indians | 0.0 /100 | #296 | Tragic 50.0% |
| Armenians | 0.0 /100 | #297 | Tragic 50.0% |
| Marshallese | 0.0 /100 | #298 | Tragic 50.1% |
| Immigrants | Micronesia | 0.0 /100 | #299 | Tragic 50.1% |
| Cape Verdeans | 0.0 /100 | #300 | Tragic 50.1% |
| Dominicans | 0.0 /100 | #301 | Tragic 50.2% |
| Cherokee | 0.0 /100 | #302 | Tragic 50.2% |
| Japanese | 0.0 /100 | #303 | Tragic 50.2% |
| Immigrants | Dominican Republic | 0.0 /100 | #304 | Tragic 50.3% |
| Central American Indians | 0.0 /100 | #305 | Tragic 50.5% |
| Immigrants | Central America | 0.0 /100 | #306 | Tragic 50.5% |
| Immigrants | Fiji | 0.0 /100 | #307 | Tragic 50.6% |
| Hispanics or Latinos | 0.0 /100 | #308 | Tragic 50.6% |
| Aleuts | 0.0 /100 | #309 | Tragic 50.6% |
| Tlingit-Haida | 0.0 /100 | #310 | Tragic 50.6% |
| Cajuns | 0.0 /100 | #311 | Tragic 50.7% |
| Cheyenne | 0.0 /100 | #312 | Tragic 50.9% |