Japanese vs Dominican Nursery School
COMPARE
Japanese
Dominican
Nursery School
Nursery School Comparison
Japanese
Dominicans
96.7%
NURSERY SCHOOL
0.0/ 100
METRIC RATING
330th/ 347
METRIC RANK
96.8%
NURSERY SCHOOL
0.0/ 100
METRIC RATING
325th/ 347
METRIC RANK
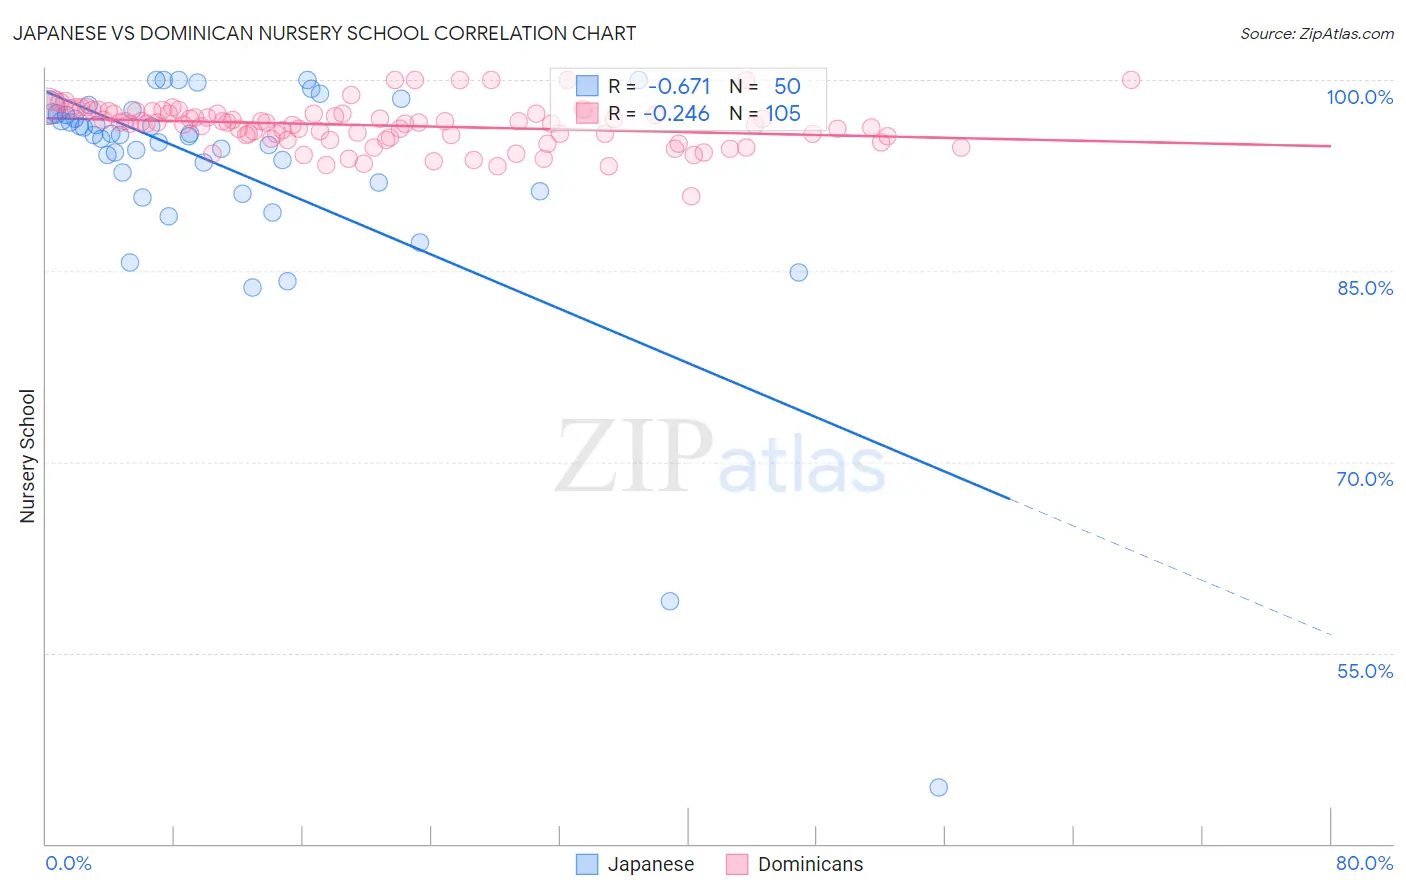
Japanese vs Dominican Nursery School Correlation Chart
The statistical analysis conducted on geographies consisting of 249,183,224 people shows a significant negative correlation between the proportion of Japanese and percentage of population with at least nursery school education in the United States with a correlation coefficient (R) of -0.671 and weighted average of 96.7%. Similarly, the statistical analysis conducted on geographies consisting of 355,142,603 people shows a weak negative correlation between the proportion of Dominicans and percentage of population with at least nursery school education in the United States with a correlation coefficient (R) of -0.246 and weighted average of 96.8%, a difference of 0.13%.
Nursery School Correlation Summary
| Measurement | Japanese | Dominican |
| Minimum | 44.4% | 90.9% |
| Maximum | 100.0% | 100.0% |
| Range | 55.6% | 9.1% |
| Mean | 93.0% | 96.4% |
| Median | 95.6% | 96.6% |
| Interquartile 25% (IQ1) | 92.0% | 95.4% |
| Interquartile 75% (IQ3) | 97.4% | 97.4% |
| Interquartile Range (IQR) | 5.4% | 2.0% |
| Standard Deviation (Sample) | 9.6% | 1.7% |
| Standard Deviation (Population) | 9.5% | 1.7% |
Demographics Similar to Japanese and Dominicans by Nursery School
In terms of nursery school, the demographic groups most similar to Japanese are Immigrants from Vietnam (96.7%, a difference of 0.010%), Immigrants from Armenia (96.7%, a difference of 0.020%), Yakama (96.6%, a difference of 0.040%), Immigrants from Latin America (96.7%, a difference of 0.060%), and Central American (96.6%, a difference of 0.060%). Similarly, the demographic groups most similar to Dominicans are Indonesian (96.8%, a difference of 0.0%), Vietnamese (96.8%, a difference of 0.030%), Mexican American Indian (96.9%, a difference of 0.040%), Immigrants from Honduras (96.9%, a difference of 0.040%), and Immigrants from Burma/Myanmar (96.9%, a difference of 0.060%).
| Demographics | Rating | Rank | Nursery School |
| Immigrants | Ecuador | 0.0 /100 | #317 | Tragic 96.9% |
| Immigrants | Guyana | 0.0 /100 | #318 | Tragic 96.9% |
| Immigrants | Laos | 0.0 /100 | #319 | Tragic 96.9% |
| Immigrants | Burma/Myanmar | 0.0 /100 | #320 | Tragic 96.9% |
| Immigrants | Bangladesh | 0.0 /100 | #321 | Tragic 96.9% |
| Mexican American Indians | 0.0 /100 | #322 | Tragic 96.9% |
| Immigrants | Honduras | 0.0 /100 | #323 | Tragic 96.9% |
| Vietnamese | 0.0 /100 | #324 | Tragic 96.8% |
| Dominicans | 0.0 /100 | #325 | Tragic 96.8% |
| Indonesians | 0.0 /100 | #326 | Tragic 96.8% |
| Mexicans | 0.0 /100 | #327 | Tragic 96.8% |
| Immigrants | Latin America | 0.0 /100 | #328 | Tragic 96.7% |
| Immigrants | Vietnam | 0.0 /100 | #329 | Tragic 96.7% |
| Japanese | 0.0 /100 | #330 | Tragic 96.7% |
| Immigrants | Armenia | 0.0 /100 | #331 | Tragic 96.7% |
| Yakama | 0.0 /100 | #332 | Tragic 96.6% |
| Central Americans | 0.0 /100 | #333 | Tragic 96.6% |
| Immigrants | Dominican Republic | 0.0 /100 | #334 | Tragic 96.6% |
| Bangladeshis | 0.0 /100 | #335 | Tragic 96.6% |
| Guatemalans | 0.0 /100 | #336 | Tragic 96.6% |
| Immigrants | Cambodia | 0.0 /100 | #337 | Tragic 96.5% |