Japanese vs Immigrants from Albania Bachelor's Degree
COMPARE
Japanese
Immigrants from Albania
Bachelor's Degree
Bachelor's Degree Comparison
Japanese
Immigrants from Albania
33.3%
BACHELOR'S DEGREE
0.7/ 100
METRIC RATING
251st/ 347
METRIC RANK
40.4%
BACHELOR'S DEGREE
94.4/ 100
METRIC RATING
122nd/ 347
METRIC RANK
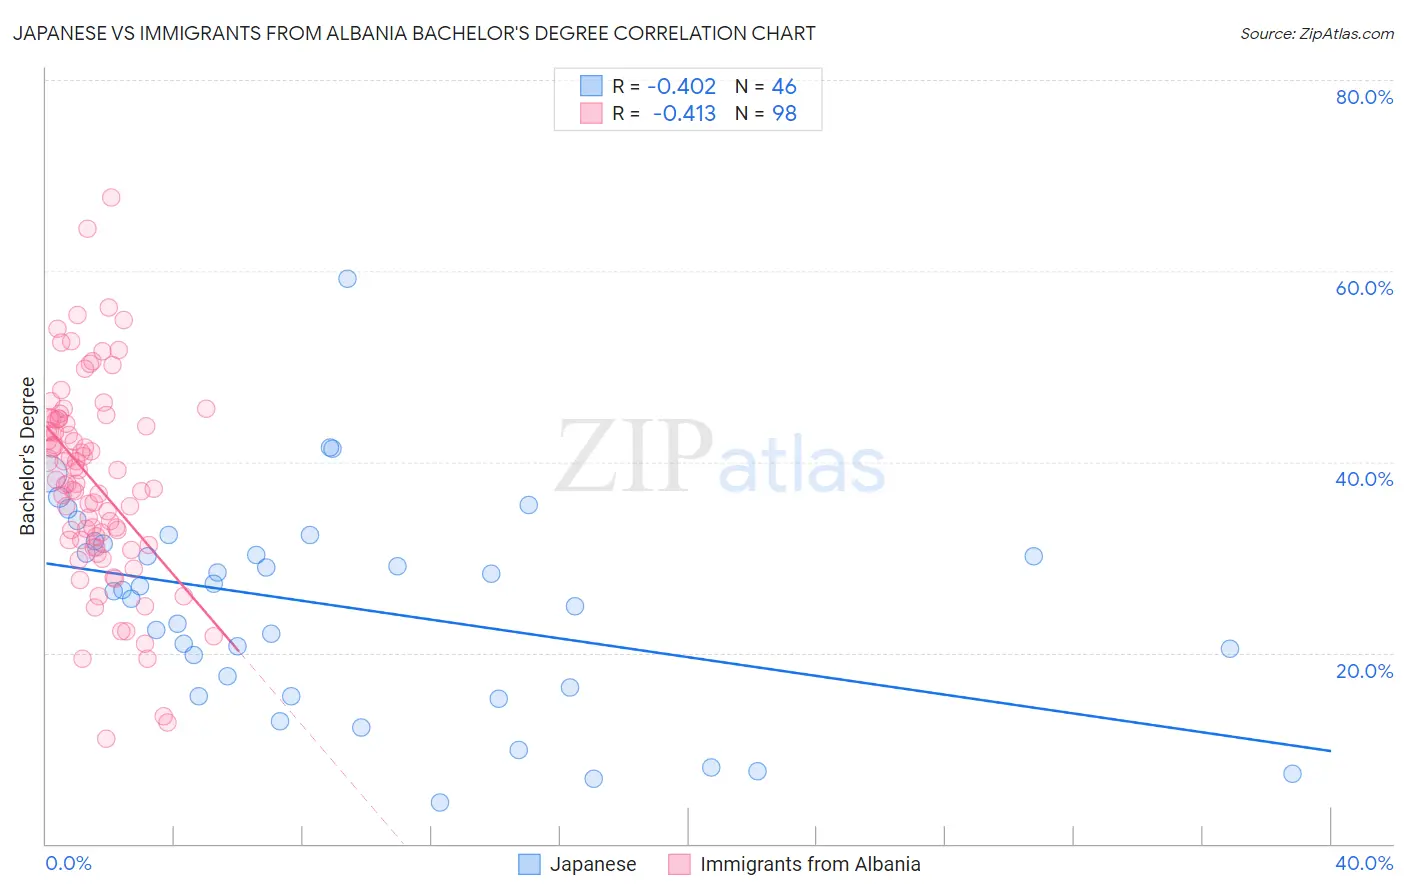
Japanese vs Immigrants from Albania Bachelor's Degree Correlation Chart
The statistical analysis conducted on geographies consisting of 249,171,435 people shows a moderate negative correlation between the proportion of Japanese and percentage of population with at least bachelor's degree education in the United States with a correlation coefficient (R) of -0.402 and weighted average of 33.3%. Similarly, the statistical analysis conducted on geographies consisting of 119,391,185 people shows a moderate negative correlation between the proportion of Immigrants from Albania and percentage of population with at least bachelor's degree education in the United States with a correlation coefficient (R) of -0.413 and weighted average of 40.4%, a difference of 21.3%.
Bachelor's Degree Correlation Summary
| Measurement | Japanese | Immigrants from Albania |
| Minimum | 4.3% | 11.0% |
| Maximum | 59.2% | 67.7% |
| Range | 54.9% | 56.7% |
| Mean | 24.8% | 37.9% |
| Median | 26.5% | 37.9% |
| Interquartile 25% (IQ1) | 16.3% | 31.8% |
| Interquartile 75% (IQ3) | 31.5% | 44.5% |
| Interquartile Range (IQR) | 15.1% | 12.7% |
| Standard Deviation (Sample) | 11.0% | 10.4% |
| Standard Deviation (Population) | 10.8% | 10.4% |
Similar Demographics by Bachelor's Degree
Demographics Similar to Japanese by Bachelor's Degree
In terms of bachelor's degree, the demographic groups most similar to Japanese are Immigrants from Bahamas (33.3%, a difference of 0.070%), U.S. Virgin Islander (33.2%, a difference of 0.28%), Native Hawaiian (33.2%, a difference of 0.34%), Iroquois (33.2%, a difference of 0.36%), and Nicaraguan (33.1%, a difference of 0.54%).
| Demographics | Rating | Rank | Bachelor's Degree |
| Delaware | 1.2 /100 | #244 | Tragic 33.8% |
| Immigrants | Fiji | 1.2 /100 | #245 | Tragic 33.7% |
| Jamaicans | 1.0 /100 | #246 | Tragic 33.6% |
| Immigrants | Congo | 1.0 /100 | #247 | Tragic 33.6% |
| Cree | 1.0 /100 | #248 | Tragic 33.6% |
| Immigrants | Liberia | 0.9 /100 | #249 | Tragic 33.5% |
| Indonesians | 0.9 /100 | #250 | Tragic 33.5% |
| Japanese | 0.7 /100 | #251 | Tragic 33.3% |
| Immigrants | Bahamas | 0.7 /100 | #252 | Tragic 33.3% |
| U.S. Virgin Islanders | 0.7 /100 | #253 | Tragic 33.2% |
| Native Hawaiians | 0.7 /100 | #254 | Tragic 33.2% |
| Iroquois | 0.7 /100 | #255 | Tragic 33.2% |
| Nicaraguans | 0.6 /100 | #256 | Tragic 33.1% |
| Spanish Americans | 0.6 /100 | #257 | Tragic 33.1% |
| French American Indians | 0.6 /100 | #258 | Tragic 33.1% |
Demographics Similar to Immigrants from Albania by Bachelor's Degree
In terms of bachelor's degree, the demographic groups most similar to Immigrants from Albania are Lebanese (40.4%, a difference of 0.020%), Immigrants from Eritrea (40.4%, a difference of 0.020%), British (40.4%, a difference of 0.060%), Moroccan (40.5%, a difference of 0.10%), and Immigrants from Eastern Africa (40.4%, a difference of 0.10%).
| Demographics | Rating | Rank | Bachelor's Degree |
| Palestinians | 95.8 /100 | #115 | Exceptional 40.7% |
| Immigrants | Uganda | 95.7 /100 | #116 | Exceptional 40.7% |
| Austrians | 95.5 /100 | #117 | Exceptional 40.6% |
| Croatians | 95.5 /100 | #118 | Exceptional 40.6% |
| Immigrants | Syria | 94.9 /100 | #119 | Exceptional 40.5% |
| Venezuelans | 94.7 /100 | #120 | Exceptional 40.5% |
| Moroccans | 94.6 /100 | #121 | Exceptional 40.5% |
| Immigrants | Albania | 94.4 /100 | #122 | Exceptional 40.4% |
| Lebanese | 94.3 /100 | #123 | Exceptional 40.4% |
| Immigrants | Eritrea | 94.3 /100 | #124 | Exceptional 40.4% |
| British | 94.2 /100 | #125 | Exceptional 40.4% |
| Immigrants | Eastern Africa | 94.1 /100 | #126 | Exceptional 40.4% |
| Immigrants | Jordan | 93.4 /100 | #127 | Exceptional 40.3% |
| Immigrants | Venezuela | 92.9 /100 | #128 | Exceptional 40.2% |
| Serbians | 92.4 /100 | #129 | Exceptional 40.1% |