Romanian vs Immigrants from Chile 10th Grade

COMPARE

Romanian
Race
Ancestry
AfghanAfricanAlaska NativeAlaskan AthabascanAlbanianAleutAlsatianAmericanApacheArabArapahoArgentineanArmenianAssyrian/Chaldean/SyriacAustralianAustrianBahamianBangladeshiBarbadianBasqueBelgianBelizeanBermudanBhutaneseBlackfeetBolivianBrazilianBritishBritish West IndianBulgarianBurmeseCajunCambodianCanadianCape VerdeanCarpatho RusynCelticCentral AmericanCentral American IndianCherokeeCheyenneChickasawChileanChineseChippewaChoctawColombianColvilleComancheCosta RicanCreeCreekCroatianCrowCubanCypriotCzechCzechoslovakianDanishDelawareDominicanDutchDutch West IndianEastern EuropeanEcuadorianEgyptianEnglishEstonianEthiopianEuropeanFijianFilipinoFinnishFrenchFrench American IndianFrench CanadianGermanGerman RussianGhanaianGreekGuamanian/ChamorroGuatemalanGuyaneseHaitianHmongHonduranHopiHoumaHungarianIcelanderIndian (Asian)IndonesianInupiatIranianIraqiIrishIroquoisIsraeliItalianJamaicanJapaneseJordanianKenyanKiowaKoreanLaotianLatvianLebaneseLiberianLithuanianLumbeeLuxembourgerMacedonianMalaysianMalteseMarshalleseMenomineeMexicanMexican American IndianMongolianMoroccanNative HawaiianNavajoNepaleseNew ZealanderNicaraguanNigerianNorthern EuropeanNorwegianOkinawanOsageOttawaPaiutePakistaniPalestinianPanamanianParaguayanPennsylvania GermanPeruvianPimaPolishPortuguesePotawatomiPuebloPuerto RicanPuget Sound SalishRomanianRussianSalvadoranSamoanScandinavianScotch-IrishScottishSeminoleSenegaleseSerbianShoshoneSierra LeoneanSiouxSlavicSlovakSloveneSomaliSouth AfricanSouth AmericanSouth American IndianSoviet UnionSpaniardSpanishSpanish AmericanSpanish American IndianSri LankanSubsaharan AfricanSudaneseSwedishSwissSyrianTaiwaneseThaiTlingit-HaidaTohono O'OdhamTonganTrinidadian and TobagonianTsimshianTurkishU.S. Virgin IslanderUgandanUkrainianUruguayanUteVenezuelanVietnameseWelshWest IndianYakamaYaquiYugoslavianYumanYup'ikZimbabwean
Immigration
NonimmigrantsImmigrantsAfghanistanAfricaAlbaniaArgentinaArmeniaAsiaAustraliaAustriaBahamasBangladeshBarbadosBelarusBelgiumBelizeBoliviaBosnia and HerzegovinaBrazilBulgariaBurma/MyanmarCabo VerdeCambodiaCameroonCanadaCaribbeanCentral AmericaChinaColombiaCongoCosta RicaCroatiaCubaCzechoslovakiaDenmarkDominicaDominican RepublicEastern AfricaEastern AsiaEastern EuropeEcuadorEgyptEl SalvadorEnglandEritreaEthiopiaEuropeFijiFranceGermanyGhanaGreeceGrenadaGuatemalaGuyanaHaitiHondurasHong KongHungaryIndiaIndonesiaIranIraqIrelandIsraelItalyJamaicaJapanJordanKazakhstanKenyaKoreaKuwaitLaosLatin AmericaLatviaLebanonLiberiaLithuaniaMalaysiaMexicoMicronesiaMiddle AfricaMoldovaMoroccoNepalNetherlandsNicaraguaNigeriaNorth AmericaNorth MacedoniaNorthern AfricaNorthern EuropeNorwayOceaniaPakistanPanamaPeruPhilippinesPolandPortugalRomaniaRussiaSaudi ArabiaScotlandSenegalSerbiaSierra LeoneSingaporeSomaliaSouth AfricaSouth AmericaSouth Central AsiaSouth Eastern AsiaSouthern EuropeSpainSri LankaSt. Vincent and the GrenadinesSudanSwedenSwitzerlandSyriaTaiwanThailandTrinidad and TobagoTurkeyUgandaUkraineUruguayUzbekistanVenezuelaVietnamWest IndiesWestern AfricaWestern AsiaWestern EuropeYemenZaireZimbabweAzores
Immigrants from Chile
Race
Ancestry
AfghanAfricanAlaska NativeAlaskan AthabascanAlbanianAleutAlsatianAmericanApacheArabArapahoArgentineanArmenianAssyrian/Chaldean/SyriacAustralianAustrianBahamianBangladeshiBarbadianBasqueBelgianBelizeanBermudanBhutaneseBlackfeetBolivianBrazilianBritishBritish West IndianBulgarianBurmeseCajunCambodianCanadianCape VerdeanCarpatho RusynCelticCentral AmericanCentral American IndianCherokeeCheyenneChickasawChileanChineseChippewaChoctawColombianColvilleComancheCosta RicanCreeCreekCroatianCrowCubanCypriotCzechCzechoslovakianDanishDelawareDominicanDutchDutch West IndianEastern EuropeanEcuadorianEgyptianEnglishEstonianEthiopianEuropeanFijianFilipinoFinnishFrenchFrench American IndianFrench CanadianGermanGerman RussianGhanaianGreekGuamanian/ChamorroGuatemalanGuyaneseHaitianHmongHonduranHopiHoumaHungarianIcelanderIndian (Asian)IndonesianInupiatIranianIraqiIrishIroquoisIsraeliItalianJamaicanJapaneseJordanianKenyanKiowaKoreanLaotianLatvianLebaneseLiberianLithuanianLumbeeLuxembourgerMacedonianMalaysianMalteseMarshalleseMenomineeMexicanMexican American IndianMongolianMoroccanNative HawaiianNavajoNepaleseNew ZealanderNicaraguanNigerianNorthern EuropeanNorwegianOkinawanOsageOttawaPaiutePakistaniPalestinianPanamanianParaguayanPennsylvania GermanPeruvianPimaPolishPortuguesePotawatomiPuebloPuerto RicanPuget Sound SalishRussianSalvadoranSamoanScandinavianScotch-IrishScottishSeminoleSenegaleseSerbianShoshoneSierra LeoneanSiouxSlavicSlovakSloveneSomaliSouth AfricanSouth AmericanSouth American IndianSoviet UnionSpaniardSpanishSpanish AmericanSpanish American IndianSri LankanSubsaharan AfricanSudaneseSwedishSwissSyrianTaiwaneseThaiTlingit-HaidaTohono O'OdhamTonganTrinidadian and TobagonianTsimshianTurkishU.S. Virgin IslanderUgandanUkrainianUruguayanUteVenezuelanVietnameseWelshWest IndianYakamaYaquiYugoslavianYumanYup'ikZimbabwean
Immigration
NonimmigrantsImmigrantsAfghanistanAfricaAlbaniaArgentinaArmeniaAsiaAustraliaAustriaBahamasBangladeshBarbadosBelarusBelgiumBelizeBoliviaBosnia and HerzegovinaBrazilBulgariaBurma/MyanmarCabo VerdeCambodiaCameroonCanadaCaribbeanCentral AmericaChileChinaColombiaCongoCosta RicaCroatiaCubaCzechoslovakiaDenmarkDominicaDominican RepublicEastern AfricaEastern AsiaEastern EuropeEcuadorEgyptEl SalvadorEnglandEritreaEthiopiaEuropeFijiFranceGermanyGhanaGreeceGrenadaGuatemalaGuyanaHaitiHondurasHong KongHungaryIndiaIndonesiaIranIraqIrelandIsraelItalyJamaicaJapanJordanKazakhstanKenyaKoreaKuwaitLaosLatin AmericaLatviaLebanonLiberiaLithuaniaMalaysiaMexicoMicronesiaMiddle AfricaMoldovaMoroccoNepalNetherlandsNicaraguaNigeriaNorth AmericaNorth MacedoniaNorthern AfricaNorthern EuropeNorwayOceaniaPakistanPanamaPeruPhilippinesPolandPortugalRomaniaRussiaSaudi ArabiaScotlandSenegalSerbiaSierra LeoneSingaporeSomaliaSouth AfricaSouth AmericaSouth Central AsiaSouth Eastern AsiaSouthern EuropeSpainSri LankaSt. Vincent and the GrenadinesSudanSwedenSwitzerlandSyriaTaiwanThailandTrinidad and TobagoTurkeyUgandaUkraineUruguayUzbekistanVenezuelaVietnamWest IndiesWestern AfricaWestern AsiaWestern EuropeYemenZaireZimbabweAzores
10th Grade
Income
Poverty
Unemployment
Labor Participation
Family Structure
Vehicle Availability
Education Level
Disability

10th Grade Comparison

Romanians

Immigrants from Chile

Exceptional
Poor
94.8%
10TH GRADE
99.5/ 100
METRIC RATING
76th/ 347
METRIC RANK
93.4%
10TH GRADE
18.8/ 100
METRIC RATING
209th/ 347
METRIC RANK

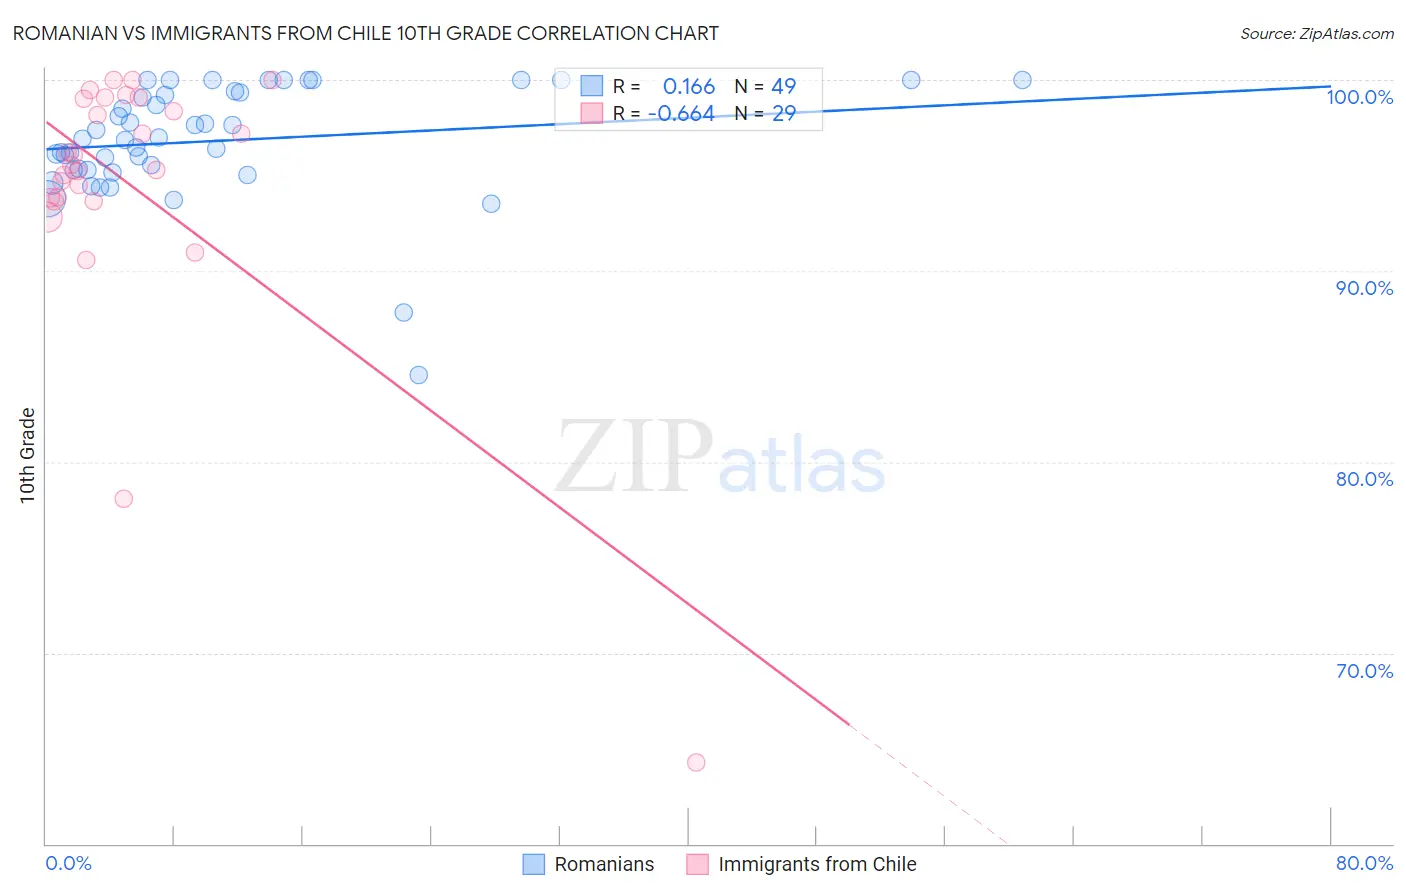
Romanian vs Immigrants from Chile 10th Grade Correlation Chart

The statistical analysis conducted on geographies consisting of 377,905,060 people shows a poor positive correlation between the proportion of Romanians and percentage of population with at least 10th grade education in the United States with a correlation coefficient (R) of 0.166 and weighted average of 94.8%. Similarly, the statistical analysis conducted on geographies consisting of 218,647,266 people shows a significant negative correlation between the proportion of Immigrants from Chile and percentage of population with at least 10th grade education in the United States with a correlation coefficient (R) of -0.664 and weighted average of 93.4%, a difference of 1.5%.
Romanian vs Immigrants from Chile 10th Grade

10th Grade Correlation Summary

MeasurementRomanianImmigrants from Chile
Minimum84.6%64.3%
Maximum100.0%100.0%
Range15.4%35.7%
Mean96.8%94.5%
Median96.9%95.6%
Interquartile 25% (IQ1)95.3%93.8%
Interquartile 75% (IQ3)99.4%99.0%
Interquartile Range (IQR)4.1%5.3%
Standard Deviation (Sample)3.1%7.2%
Standard Deviation (Population)3.0%7.1%

Similar Demographics by 10th Grade

Demographics Similar to Romanians by 10th Grade

In terms of 10th grade, the demographic groups most similar to Romanians are Immigrants from South Africa (94.8%, a difference of 0.0%), Okinawan (94.8%, a difference of 0.010%), Bhutanese (94.9%, a difference of 0.040%), Canadian (94.9%, a difference of 0.040%), and Immigrants from Sweden (94.9%, a difference of 0.050%).
DemographicsRating | Rank10th Grade
Immigrants | England
99.6
/100
|
#69
Exceptional
94.9%
Zimbabweans
99.6
/100
|
#70
Exceptional
94.9%
Alaska Natives
99.6
/100
|
#71
Exceptional
94.9%
Immigrants | Sweden
99.6
/100
|
#72
Exceptional
94.9%
Bhutanese
99.6
/100
|
#73
Exceptional
94.9%
Canadians
99.6
/100
|
#74
Exceptional
94.9%
Okinawans
99.5
/100
|
#75
Exceptional
94.8%
Romanians
99.5
/100
|
#76
Exceptional
94.8%
Immigrants | South Africa
99.5
/100
|
#77
Exceptional
94.8%
Filipinos
99.3
/100
|
#78
Exceptional
94.8%
Immigrants | Czechoslovakia
99.2
/100
|
#79
Exceptional
94.7%
Immigrants | Denmark
99.2
/100
|
#80
Exceptional
94.7%
Immigrants | Latvia
99.2
/100
|
#81
Exceptional
94.7%
Swiss
99.1
/100
|
#82
Exceptional
94.7%
Immigrants | Western Europe
99.1
/100
|
#83
Exceptional
94.7%

Demographics Similar to Immigrants from Chile by 10th Grade

In terms of 10th grade, the demographic groups most similar to Immigrants from Chile are Samoan (93.4%, a difference of 0.010%), Immigrants from Syria (93.4%, a difference of 0.010%), Immigrants from Western Asia (93.4%, a difference of 0.020%), Ute (93.4%, a difference of 0.020%), and Immigrants from Indonesia (93.4%, a difference of 0.020%).
DemographicsRating | Rank10th Grade
Immigrants | Uganda
20.9
/100
|
#202
Fair
93.5%
Immigrants | Western Asia
20.6
/100
|
#203
Fair
93.4%
Ute
20.3
/100
|
#204
Fair
93.4%
Immigrants | Indonesia
20.2
/100
|
#205
Fair
93.4%
Immigrants | Sudan
20.0
/100
|
#206
Fair
93.4%
Samoans
19.5
/100
|
#207
Poor
93.4%
Immigrants | Syria
19.4
/100
|
#208
Poor
93.4%
Immigrants | Chile
18.8
/100
|
#209
Poor
93.4%
Indians (Asian)
17.6
/100
|
#210
Poor
93.4%
Cajuns
16.9
/100
|
#211
Poor
93.4%
Immigrants | Zaire
16.7
/100
|
#212
Poor
93.4%
Immigrants | Asia
15.7
/100
|
#213
Poor
93.4%
Immigrants | Bahamas
15.2
/100
|
#214
Poor
93.4%
Immigrants | Oceania
15.1
/100
|
#215
Poor
93.4%
Immigrants | Eastern Africa
14.7
/100
|
#216
Poor
93.4%