Jamaican vs Immigrants from Poland 10th Grade
COMPARE
Jamaican
Immigrants from Poland
10th Grade
10th Grade Comparison
Jamaicans
Immigrants from Poland
92.8%
10TH GRADE
1.2/ 100
METRIC RATING
250th/ 347
METRIC RANK
93.9%
10TH GRADE
69.6/ 100
METRIC RATING
162nd/ 347
METRIC RANK
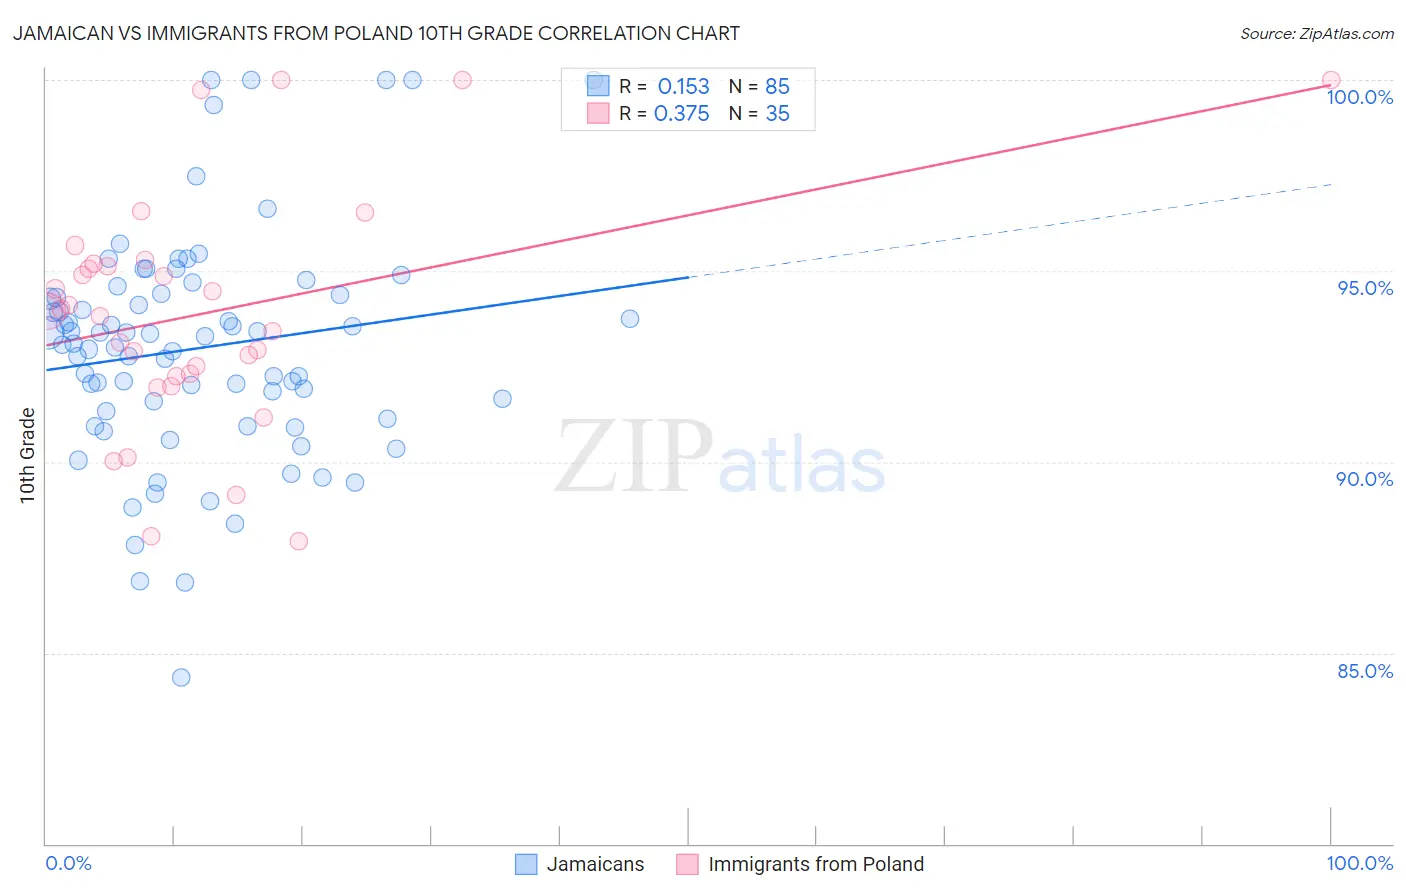
Jamaican vs Immigrants from Poland 10th Grade Correlation Chart
The statistical analysis conducted on geographies consisting of 368,084,732 people shows a poor positive correlation between the proportion of Jamaicans and percentage of population with at least 10th grade education in the United States with a correlation coefficient (R) of 0.153 and weighted average of 92.8%. Similarly, the statistical analysis conducted on geographies consisting of 304,861,877 people shows a mild positive correlation between the proportion of Immigrants from Poland and percentage of population with at least 10th grade education in the United States with a correlation coefficient (R) of 0.375 and weighted average of 93.9%, a difference of 1.2%.
10th Grade Correlation Summary
| Measurement | Jamaican | Immigrants from Poland |
| Minimum | 84.4% | 87.9% |
| Maximum | 100.0% | 100.0% |
| Range | 15.6% | 12.1% |
| Mean | 93.0% | 93.9% |
| Median | 93.1% | 94.0% |
| Interquartile 25% (IQ1) | 91.2% | 92.3% |
| Interquartile 75% (IQ3) | 94.4% | 95.2% |
| Interquartile Range (IQR) | 3.2% | 2.9% |
| Standard Deviation (Sample) | 3.0% | 3.1% |
| Standard Deviation (Population) | 3.0% | 3.0% |
Similar Demographics by 10th Grade
Demographics Similar to Jamaicans by 10th Grade
In terms of 10th grade, the demographic groups most similar to Jamaicans are Immigrants from Senegal (92.8%, a difference of 0.020%), Colombian (92.8%, a difference of 0.030%), Immigrants from Afghanistan (92.8%, a difference of 0.040%), Immigrants from Thailand (92.8%, a difference of 0.050%), and South American (92.8%, a difference of 0.060%).
| Demographics | Rating | Rank | 10th Grade |
| Senegalese | 2.4 /100 | #243 | Tragic 93.0% |
| Spanish Americans | 2.1 /100 | #244 | Tragic 92.9% |
| Uruguayans | 1.8 /100 | #245 | Tragic 92.9% |
| Immigrants | Middle Africa | 1.7 /100 | #246 | Tragic 92.9% |
| Immigrants | Afghanistan | 1.4 /100 | #247 | Tragic 92.8% |
| Colombians | 1.4 /100 | #248 | Tragic 92.8% |
| Immigrants | Senegal | 1.4 /100 | #249 | Tragic 92.8% |
| Jamaicans | 1.2 /100 | #250 | Tragic 92.8% |
| Immigrants | Thailand | 1.0 /100 | #251 | Tragic 92.8% |
| South Americans | 0.9 /100 | #252 | Tragic 92.8% |
| Ghanaians | 0.9 /100 | #253 | Tragic 92.8% |
| Armenians | 0.9 /100 | #254 | Tragic 92.7% |
| Immigrants | Bolivia | 0.7 /100 | #255 | Tragic 92.7% |
| Immigrants | Nigeria | 0.7 /100 | #256 | Tragic 92.7% |
| U.S. Virgin Islanders | 0.7 /100 | #257 | Tragic 92.7% |
Demographics Similar to Immigrants from Poland by 10th Grade
In terms of 10th grade, the demographic groups most similar to Immigrants from Poland are Assyrian/Chaldean/Syriac (93.9%, a difference of 0.0%), Venezuelan (93.9%, a difference of 0.0%), Chilean (93.9%, a difference of 0.010%), Pakistani (93.9%, a difference of 0.010%), and Bermudan (93.9%, a difference of 0.020%).
| Demographics | Rating | Rank | 10th Grade |
| Spanish | 74.9 /100 | #155 | Good 94.0% |
| Mongolians | 74.4 /100 | #156 | Good 94.0% |
| Kiowa | 73.3 /100 | #157 | Good 93.9% |
| Bermudans | 71.0 /100 | #158 | Good 93.9% |
| Chileans | 70.2 /100 | #159 | Good 93.9% |
| Pakistanis | 70.1 /100 | #160 | Good 93.9% |
| Assyrians/Chaldeans/Syriacs | 69.7 /100 | #161 | Good 93.9% |
| Immigrants | Poland | 69.6 /100 | #162 | Good 93.9% |
| Venezuelans | 69.5 /100 | #163 | Good 93.9% |
| Iraqis | 68.1 /100 | #164 | Good 93.9% |
| Brazilians | 63.6 /100 | #165 | Good 93.8% |
| Immigrants | Iraq | 63.0 /100 | #166 | Good 93.8% |
| Immigrants | Egypt | 62.3 /100 | #167 | Good 93.8% |
| Alsatians | 59.4 /100 | #168 | Average 93.8% |
| Immigrants | Spain | 55.9 /100 | #169 | Average 93.8% |