Jamaican vs Potawatomi 10th Grade
COMPARE
Jamaican
Potawatomi
10th Grade
10th Grade Comparison
Jamaicans
Potawatomi
92.8%
10TH GRADE
1.2/ 100
METRIC RATING
250th/ 347
METRIC RANK
94.3%
10TH GRADE
93.6/ 100
METRIC RATING
128th/ 347
METRIC RANK
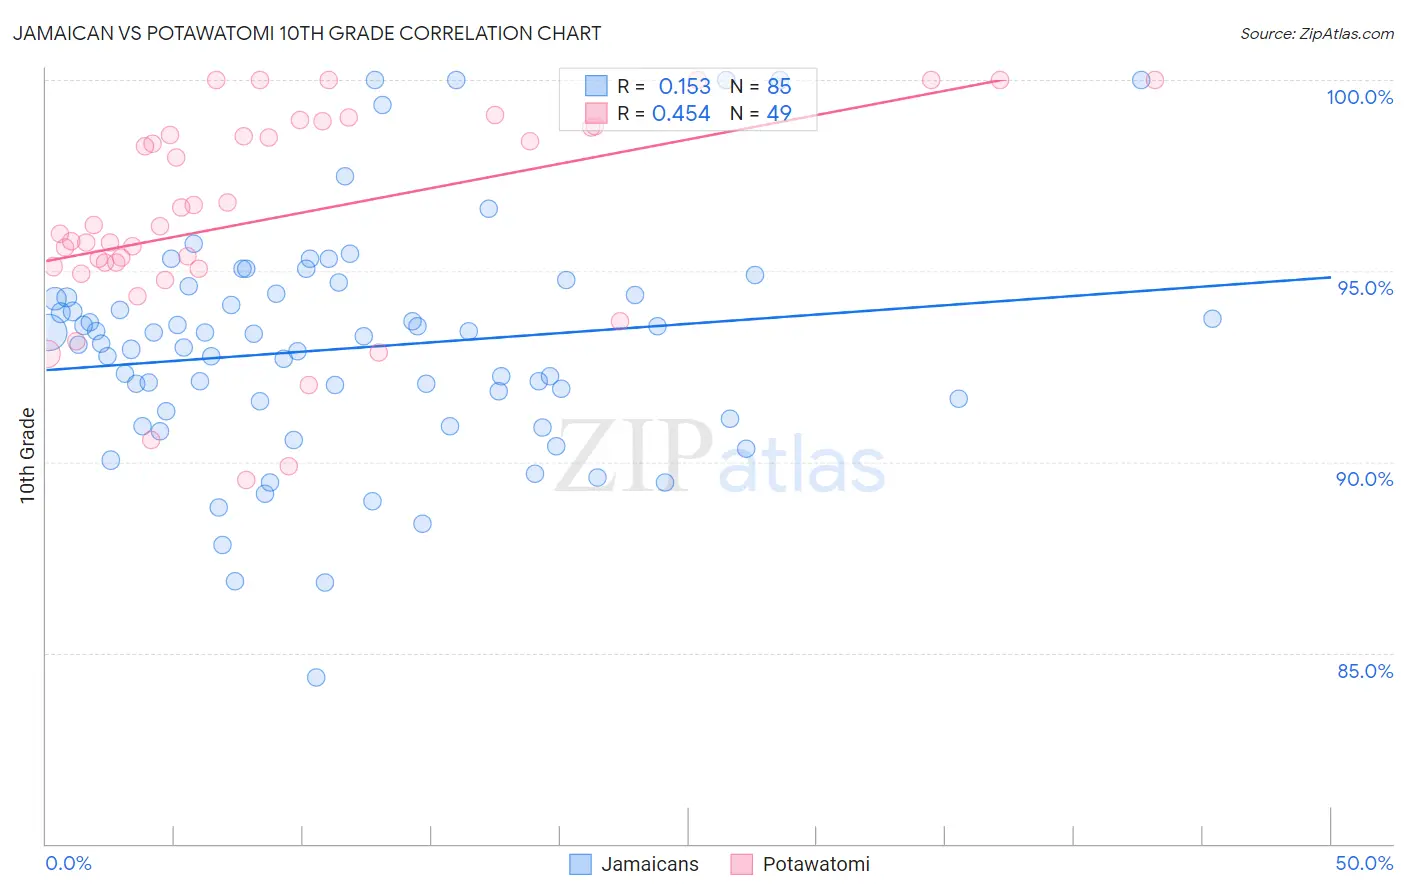
Jamaican vs Potawatomi 10th Grade Correlation Chart
The statistical analysis conducted on geographies consisting of 368,084,732 people shows a poor positive correlation between the proportion of Jamaicans and percentage of population with at least 10th grade education in the United States with a correlation coefficient (R) of 0.153 and weighted average of 92.8%. Similarly, the statistical analysis conducted on geographies consisting of 117,769,158 people shows a moderate positive correlation between the proportion of Potawatomi and percentage of population with at least 10th grade education in the United States with a correlation coefficient (R) of 0.454 and weighted average of 94.3%, a difference of 1.6%.
10th Grade Correlation Summary
| Measurement | Jamaican | Potawatomi |
| Minimum | 84.4% | 89.5% |
| Maximum | 100.0% | 100.0% |
| Range | 15.6% | 10.5% |
| Mean | 93.0% | 96.4% |
| Median | 93.1% | 96.2% |
| Interquartile 25% (IQ1) | 91.2% | 95.1% |
| Interquartile 75% (IQ3) | 94.4% | 98.8% |
| Interquartile Range (IQR) | 3.2% | 3.7% |
| Standard Deviation (Sample) | 3.0% | 2.8% |
| Standard Deviation (Population) | 3.0% | 2.7% |
Similar Demographics by 10th Grade
Demographics Similar to Jamaicans by 10th Grade
In terms of 10th grade, the demographic groups most similar to Jamaicans are Immigrants from Senegal (92.8%, a difference of 0.020%), Colombian (92.8%, a difference of 0.030%), Immigrants from Afghanistan (92.8%, a difference of 0.040%), Immigrants from Thailand (92.8%, a difference of 0.050%), and South American (92.8%, a difference of 0.060%).
| Demographics | Rating | Rank | 10th Grade |
| Senegalese | 2.4 /100 | #243 | Tragic 93.0% |
| Spanish Americans | 2.1 /100 | #244 | Tragic 92.9% |
| Uruguayans | 1.8 /100 | #245 | Tragic 92.9% |
| Immigrants | Middle Africa | 1.7 /100 | #246 | Tragic 92.9% |
| Immigrants | Afghanistan | 1.4 /100 | #247 | Tragic 92.8% |
| Colombians | 1.4 /100 | #248 | Tragic 92.8% |
| Immigrants | Senegal | 1.4 /100 | #249 | Tragic 92.8% |
| Jamaicans | 1.2 /100 | #250 | Tragic 92.8% |
| Immigrants | Thailand | 1.0 /100 | #251 | Tragic 92.8% |
| South Americans | 0.9 /100 | #252 | Tragic 92.8% |
| Ghanaians | 0.9 /100 | #253 | Tragic 92.8% |
| Armenians | 0.9 /100 | #254 | Tragic 92.7% |
| Immigrants | Bolivia | 0.7 /100 | #255 | Tragic 92.7% |
| Immigrants | Nigeria | 0.7 /100 | #256 | Tragic 92.7% |
| U.S. Virgin Islanders | 0.7 /100 | #257 | Tragic 92.7% |
Demographics Similar to Potawatomi by 10th Grade
In terms of 10th grade, the demographic groups most similar to Potawatomi are Israeli (94.3%, a difference of 0.010%), American (94.3%, a difference of 0.030%), Immigrants from Iran (94.3%, a difference of 0.030%), Iroquois (94.3%, a difference of 0.030%), and Immigrants from Greece (94.3%, a difference of 0.030%).
| Demographics | Rating | Rank | 10th Grade |
| Immigrants | Belarus | 95.2 /100 | #121 | Exceptional 94.4% |
| Inupiat | 95.1 /100 | #122 | Exceptional 94.4% |
| Cree | 95.1 /100 | #123 | Exceptional 94.4% |
| Basques | 94.9 /100 | #124 | Exceptional 94.3% |
| Americans | 94.4 /100 | #125 | Exceptional 94.3% |
| Immigrants | Iran | 94.4 /100 | #126 | Exceptional 94.3% |
| Israelis | 93.8 /100 | #127 | Exceptional 94.3% |
| Potawatomi | 93.6 /100 | #128 | Exceptional 94.3% |
| Iroquois | 92.8 /100 | #129 | Exceptional 94.3% |
| Immigrants | Greece | 92.7 /100 | #130 | Exceptional 94.3% |
| Immigrants | Eastern Europe | 92.5 /100 | #131 | Exceptional 94.3% |
| Immigrants | Russia | 92.4 /100 | #132 | Exceptional 94.3% |
| Creek | 91.9 /100 | #133 | Exceptional 94.2% |
| Osage | 91.7 /100 | #134 | Exceptional 94.2% |
| Immigrants | Korea | 91.3 /100 | #135 | Exceptional 94.2% |