Sioux vs Immigrants from Chile 10th Grade
COMPARE
Sioux
Immigrants from Chile
10th Grade
10th Grade Comparison
Sioux
Immigrants from Chile
94.4%
10TH GRADE
96.2/ 100
METRIC RATING
116th/ 347
METRIC RANK
93.4%
10TH GRADE
18.8/ 100
METRIC RATING
209th/ 347
METRIC RANK
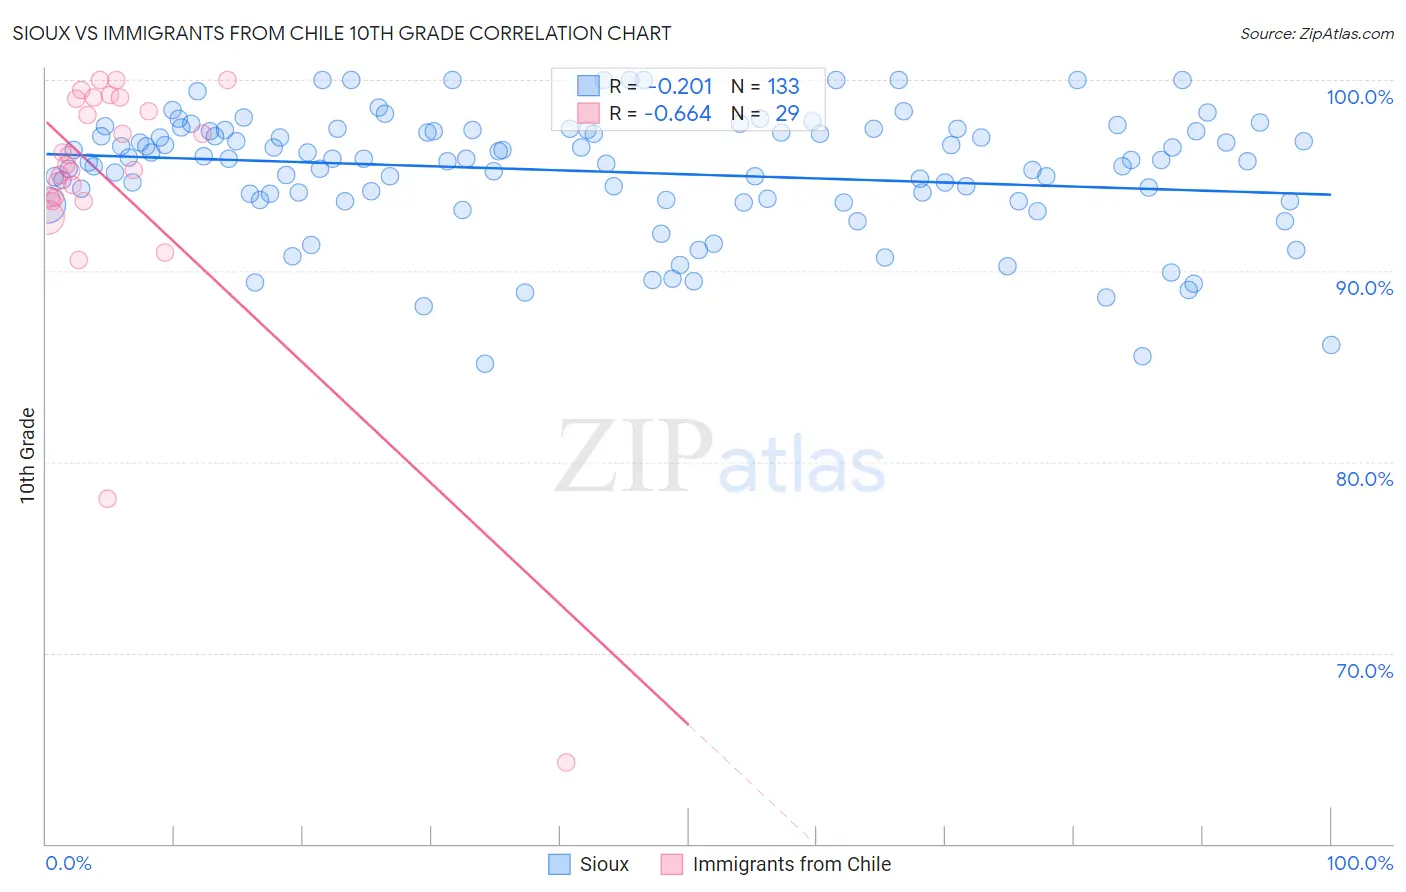
Sioux vs Immigrants from Chile 10th Grade Correlation Chart
The statistical analysis conducted on geographies consisting of 234,198,073 people shows a weak negative correlation between the proportion of Sioux and percentage of population with at least 10th grade education in the United States with a correlation coefficient (R) of -0.201 and weighted average of 94.4%. Similarly, the statistical analysis conducted on geographies consisting of 218,647,266 people shows a significant negative correlation between the proportion of Immigrants from Chile and percentage of population with at least 10th grade education in the United States with a correlation coefficient (R) of -0.664 and weighted average of 93.4%, a difference of 1.1%.
10th Grade Correlation Summary
| Measurement | Sioux | Immigrants from Chile |
| Minimum | 85.2% | 64.3% |
| Maximum | 100.0% | 100.0% |
| Range | 14.8% | 35.7% |
| Mean | 95.2% | 94.5% |
| Median | 95.9% | 95.6% |
| Interquartile 25% (IQ1) | 93.7% | 93.8% |
| Interquartile 75% (IQ3) | 97.4% | 99.0% |
| Interquartile Range (IQR) | 3.6% | 5.3% |
| Standard Deviation (Sample) | 3.2% | 7.2% |
| Standard Deviation (Population) | 3.2% | 7.1% |
Similar Demographics by 10th Grade
Demographics Similar to Sioux by 10th Grade
In terms of 10th grade, the demographic groups most similar to Sioux are German Russian (94.4%, a difference of 0.0%), Delaware (94.4%, a difference of 0.0%), Palestinian (94.4%, a difference of 0.020%), Immigrants from Hungary (94.4%, a difference of 0.030%), and Immigrants from Zimbabwe (94.4%, a difference of 0.040%).
| Demographics | Rating | Rank | 10th Grade |
| Immigrants | Norway | 97.2 /100 | #109 | Exceptional 94.5% |
| Burmese | 97.1 /100 | #110 | Exceptional 94.5% |
| Immigrants | Zimbabwe | 96.8 /100 | #111 | Exceptional 94.4% |
| Immigrants | Kuwait | 96.8 /100 | #112 | Exceptional 94.4% |
| Palestinians | 96.5 /100 | #113 | Exceptional 94.4% |
| German Russians | 96.3 /100 | #114 | Exceptional 94.4% |
| Delaware | 96.3 /100 | #115 | Exceptional 94.4% |
| Sioux | 96.2 /100 | #116 | Exceptional 94.4% |
| Immigrants | Hungary | 95.8 /100 | #117 | Exceptional 94.4% |
| Jordanians | 95.6 /100 | #118 | Exceptional 94.4% |
| Immigrants | Israel | 95.4 /100 | #119 | Exceptional 94.4% |
| Immigrants | Taiwan | 95.3 /100 | #120 | Exceptional 94.4% |
| Immigrants | Belarus | 95.2 /100 | #121 | Exceptional 94.4% |
| Inupiat | 95.1 /100 | #122 | Exceptional 94.4% |
| Cree | 95.1 /100 | #123 | Exceptional 94.4% |
Demographics Similar to Immigrants from Chile by 10th Grade
In terms of 10th grade, the demographic groups most similar to Immigrants from Chile are Samoan (93.4%, a difference of 0.010%), Immigrants from Syria (93.4%, a difference of 0.010%), Immigrants from Western Asia (93.4%, a difference of 0.020%), Ute (93.4%, a difference of 0.020%), and Immigrants from Indonesia (93.4%, a difference of 0.020%).
| Demographics | Rating | Rank | 10th Grade |
| Immigrants | Uganda | 20.9 /100 | #202 | Fair 93.5% |
| Immigrants | Western Asia | 20.6 /100 | #203 | Fair 93.4% |
| Ute | 20.3 /100 | #204 | Fair 93.4% |
| Immigrants | Indonesia | 20.2 /100 | #205 | Fair 93.4% |
| Immigrants | Sudan | 20.0 /100 | #206 | Fair 93.4% |
| Samoans | 19.5 /100 | #207 | Poor 93.4% |
| Immigrants | Syria | 19.4 /100 | #208 | Poor 93.4% |
| Immigrants | Chile | 18.8 /100 | #209 | Poor 93.4% |
| Indians (Asian) | 17.6 /100 | #210 | Poor 93.4% |
| Cajuns | 16.9 /100 | #211 | Poor 93.4% |
| Immigrants | Zaire | 16.7 /100 | #212 | Poor 93.4% |
| Immigrants | Asia | 15.7 /100 | #213 | Poor 93.4% |
| Immigrants | Bahamas | 15.2 /100 | #214 | Poor 93.4% |
| Immigrants | Oceania | 15.1 /100 | #215 | Poor 93.4% |
| Immigrants | Eastern Africa | 14.7 /100 | #216 | Poor 93.4% |