Jamaican vs Immigrants from Venezuela 10th Grade
COMPARE
Jamaican
Immigrants from Venezuela
10th Grade
10th Grade Comparison
Jamaicans
Immigrants from Venezuela
92.8%
10TH GRADE
1.2/ 100
METRIC RATING
250th/ 347
METRIC RANK
93.8%
10TH GRADE
53.9/ 100
METRIC RATING
170th/ 347
METRIC RANK
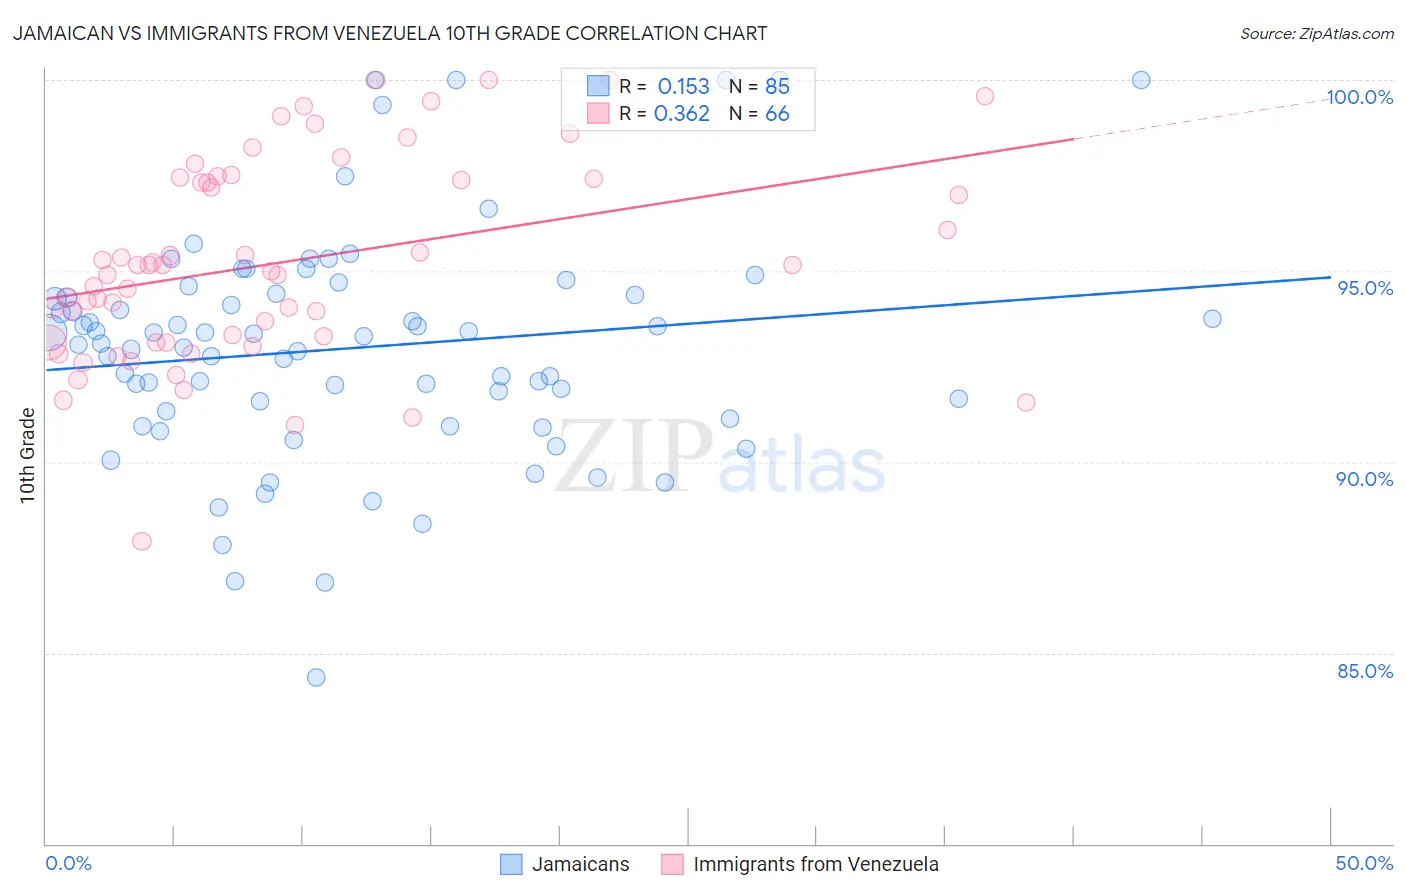
Jamaican vs Immigrants from Venezuela 10th Grade Correlation Chart
The statistical analysis conducted on geographies consisting of 368,084,732 people shows a poor positive correlation between the proportion of Jamaicans and percentage of population with at least 10th grade education in the United States with a correlation coefficient (R) of 0.153 and weighted average of 92.8%. Similarly, the statistical analysis conducted on geographies consisting of 287,866,258 people shows a mild positive correlation between the proportion of Immigrants from Venezuela and percentage of population with at least 10th grade education in the United States with a correlation coefficient (R) of 0.362 and weighted average of 93.8%, a difference of 1.0%.
10th Grade Correlation Summary
| Measurement | Jamaican | Immigrants from Venezuela |
| Minimum | 84.4% | 87.9% |
| Maximum | 100.0% | 100.0% |
| Range | 15.6% | 12.1% |
| Mean | 93.0% | 95.2% |
| Median | 93.1% | 95.1% |
| Interquartile 25% (IQ1) | 91.2% | 93.1% |
| Interquartile 75% (IQ3) | 94.4% | 97.4% |
| Interquartile Range (IQR) | 3.2% | 4.3% |
| Standard Deviation (Sample) | 3.0% | 2.6% |
| Standard Deviation (Population) | 3.0% | 2.6% |
Similar Demographics by 10th Grade
Demographics Similar to Jamaicans by 10th Grade
In terms of 10th grade, the demographic groups most similar to Jamaicans are Immigrants from Senegal (92.8%, a difference of 0.020%), Colombian (92.8%, a difference of 0.030%), Immigrants from Afghanistan (92.8%, a difference of 0.040%), Immigrants from Thailand (92.8%, a difference of 0.050%), and South American (92.8%, a difference of 0.060%).
| Demographics | Rating | Rank | 10th Grade |
| Senegalese | 2.4 /100 | #243 | Tragic 93.0% |
| Spanish Americans | 2.1 /100 | #244 | Tragic 92.9% |
| Uruguayans | 1.8 /100 | #245 | Tragic 92.9% |
| Immigrants | Middle Africa | 1.7 /100 | #246 | Tragic 92.9% |
| Immigrants | Afghanistan | 1.4 /100 | #247 | Tragic 92.8% |
| Colombians | 1.4 /100 | #248 | Tragic 92.8% |
| Immigrants | Senegal | 1.4 /100 | #249 | Tragic 92.8% |
| Jamaicans | 1.2 /100 | #250 | Tragic 92.8% |
| Immigrants | Thailand | 1.0 /100 | #251 | Tragic 92.8% |
| South Americans | 0.9 /100 | #252 | Tragic 92.8% |
| Ghanaians | 0.9 /100 | #253 | Tragic 92.8% |
| Armenians | 0.9 /100 | #254 | Tragic 92.7% |
| Immigrants | Bolivia | 0.7 /100 | #255 | Tragic 92.7% |
| Immigrants | Nigeria | 0.7 /100 | #256 | Tragic 92.7% |
| U.S. Virgin Islanders | 0.7 /100 | #257 | Tragic 92.7% |
Demographics Similar to Immigrants from Venezuela by 10th Grade
In terms of 10th grade, the demographic groups most similar to Immigrants from Venezuela are Immigrants from Albania (93.8%, a difference of 0.010%), Immigrants from Spain (93.8%, a difference of 0.020%), French American Indian (93.7%, a difference of 0.030%), Spaniard (93.7%, a difference of 0.030%), and Argentinean (93.7%, a difference of 0.030%).
| Demographics | Rating | Rank | 10th Grade |
| Venezuelans | 69.5 /100 | #163 | Good 93.9% |
| Iraqis | 68.1 /100 | #164 | Good 93.9% |
| Brazilians | 63.6 /100 | #165 | Good 93.8% |
| Immigrants | Iraq | 63.0 /100 | #166 | Good 93.8% |
| Immigrants | Egypt | 62.3 /100 | #167 | Good 93.8% |
| Alsatians | 59.4 /100 | #168 | Average 93.8% |
| Immigrants | Spain | 55.9 /100 | #169 | Average 93.8% |
| Immigrants | Venezuela | 53.9 /100 | #170 | Average 93.8% |
| Immigrants | Albania | 52.4 /100 | #171 | Average 93.8% |
| French American Indians | 50.9 /100 | #172 | Average 93.7% |
| Spaniards | 50.3 /100 | #173 | Average 93.7% |
| Argentineans | 50.0 /100 | #174 | Average 93.7% |
| Immigrants | Nepal | 49.6 /100 | #175 | Average 93.7% |
| Immigrants | Argentina | 47.1 /100 | #176 | Average 93.7% |
| Immigrants | Lebanon | 47.1 /100 | #177 | Average 93.7% |