Italian vs Immigrants from Latin America Doctorate Degree
COMPARE
Italian
Immigrants from Latin America
Doctorate Degree
Doctorate Degree Comparison
Italians
Immigrants from Latin America
2.0%
DOCTORATE DEGREE
86.0/ 100
METRIC RATING
142nd/ 347
METRIC RANK
1.3%
DOCTORATE DEGREE
0.0/ 100
METRIC RATING
331st/ 347
METRIC RANK
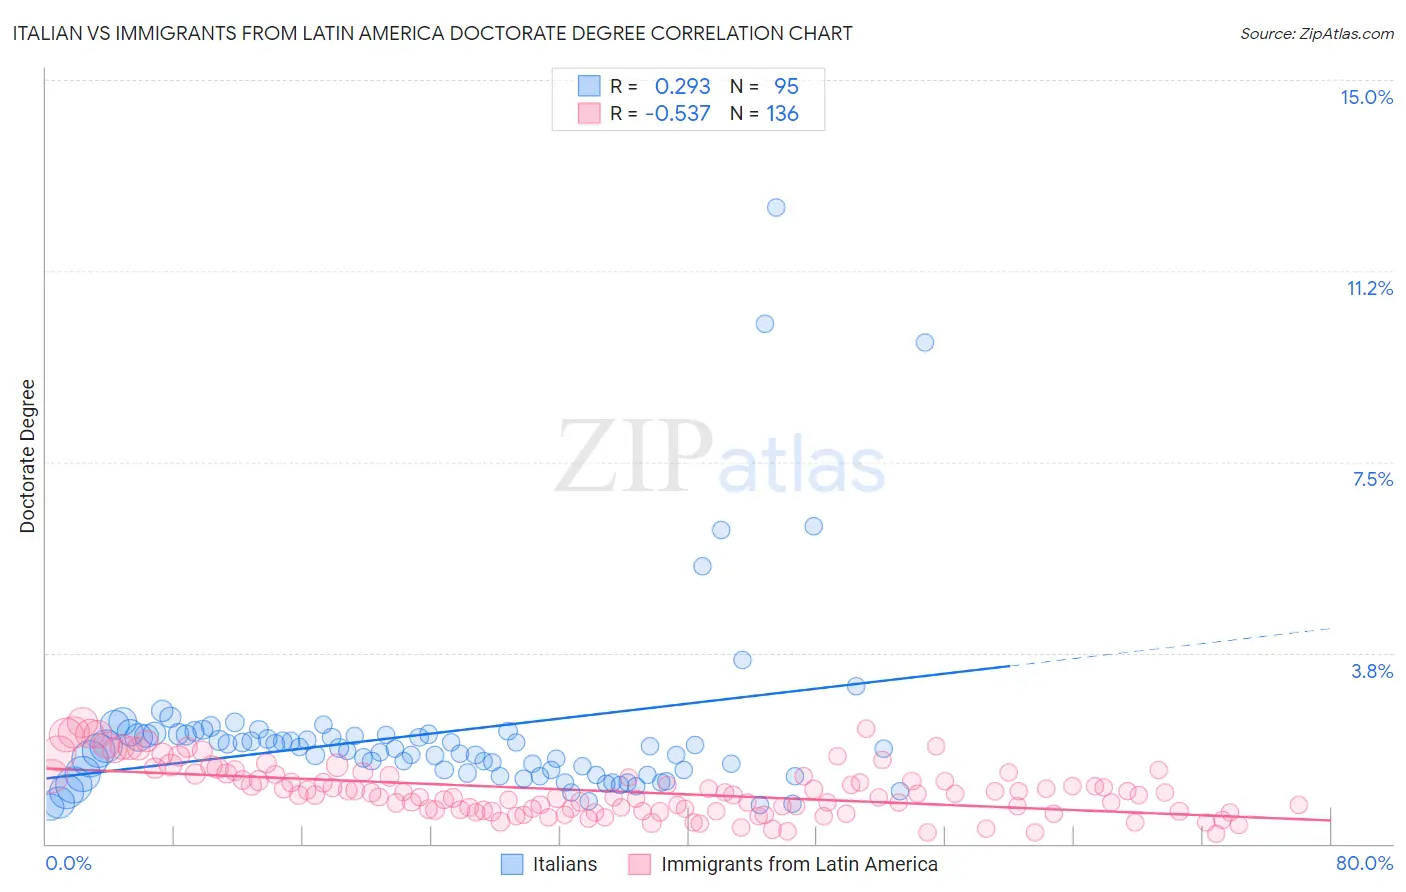
Italian vs Immigrants from Latin America Doctorate Degree Correlation Chart
The statistical analysis conducted on geographies consisting of 549,362,939 people shows a weak positive correlation between the proportion of Italians and percentage of population with at least doctorate degree education in the United States with a correlation coefficient (R) of 0.293 and weighted average of 2.0%. Similarly, the statistical analysis conducted on geographies consisting of 538,199,058 people shows a substantial negative correlation between the proportion of Immigrants from Latin America and percentage of population with at least doctorate degree education in the United States with a correlation coefficient (R) of -0.537 and weighted average of 1.3%, a difference of 50.4%.
Doctorate Degree Correlation Summary
| Measurement | Italian | Immigrants from Latin America |
| Minimum | 0.72% | 0.19% |
| Maximum | 12.5% | 2.4% |
| Range | 11.8% | 2.2% |
| Mean | 2.2% | 1.0% |
| Median | 1.9% | 0.97% |
| Interquartile 25% (IQ1) | 1.4% | 0.65% |
| Interquartile 75% (IQ3) | 2.1% | 1.3% |
| Interquartile Range (IQR) | 0.77% | 0.68% |
| Standard Deviation (Sample) | 1.8% | 0.50% |
| Standard Deviation (Population) | 1.8% | 0.50% |
Similar Demographics by Doctorate Degree
Demographics Similar to Italians by Doctorate Degree
In terms of doctorate degree, the demographic groups most similar to Italians are Senegalese (2.0%, a difference of 0.21%), Sierra Leonean (2.0%, a difference of 0.25%), Immigrants from Africa (2.0%, a difference of 0.28%), Afghan (2.0%, a difference of 0.36%), and Immigrants from Moldova (2.0%, a difference of 0.46%).
| Demographics | Rating | Rank | Doctorate Degree |
| Serbians | 88.7 /100 | #135 | Excellent 2.0% |
| Swedes | 88.3 /100 | #136 | Excellent 2.0% |
| South American Indians | 88.3 /100 | #137 | Excellent 2.0% |
| Swiss | 88.0 /100 | #138 | Excellent 2.0% |
| Afghans | 87.2 /100 | #139 | Excellent 2.0% |
| Immigrants | Africa | 87.0 /100 | #140 | Excellent 2.0% |
| Senegalese | 86.7 /100 | #141 | Excellent 2.0% |
| Italians | 86.0 /100 | #142 | Excellent 2.0% |
| Sierra Leoneans | 85.1 /100 | #143 | Excellent 2.0% |
| Immigrants | Moldova | 84.3 /100 | #144 | Excellent 2.0% |
| Kenyans | 83.6 /100 | #145 | Excellent 1.9% |
| Immigrants | Syria | 83.6 /100 | #146 | Excellent 1.9% |
| Immigrants | Senegal | 82.5 /100 | #147 | Excellent 1.9% |
| Luxembourgers | 81.1 /100 | #148 | Excellent 1.9% |
| Basques | 76.9 /100 | #149 | Good 1.9% |
Demographics Similar to Immigrants from Latin America by Doctorate Degree
In terms of doctorate degree, the demographic groups most similar to Immigrants from Latin America are Yup'ik (1.3%, a difference of 0.010%), Haitian (1.3%, a difference of 0.23%), Inupiat (1.3%, a difference of 0.28%), Hispanic or Latino (1.3%, a difference of 0.86%), and Immigrants from Cabo Verde (1.3%, a difference of 1.1%).
| Demographics | Rating | Rank | Doctorate Degree |
| Natives/Alaskans | 0.0 /100 | #324 | Tragic 1.3% |
| Pima | 0.0 /100 | #325 | Tragic 1.3% |
| Immigrants | Cabo Verde | 0.0 /100 | #326 | Tragic 1.3% |
| Hispanics or Latinos | 0.0 /100 | #327 | Tragic 1.3% |
| Inupiat | 0.0 /100 | #328 | Tragic 1.3% |
| Haitians | 0.0 /100 | #329 | Tragic 1.3% |
| Yup'ik | 0.0 /100 | #330 | Tragic 1.3% |
| Immigrants | Latin America | 0.0 /100 | #331 | Tragic 1.3% |
| Yakama | 0.0 /100 | #332 | Tragic 1.3% |
| Immigrants | Caribbean | 0.0 /100 | #333 | Tragic 1.3% |
| Immigrants | Dominican Republic | 0.0 /100 | #334 | Tragic 1.3% |
| Immigrants | Haiti | 0.0 /100 | #335 | Tragic 1.3% |
| Nepalese | 0.0 /100 | #336 | Tragic 1.3% |
| Bangladeshis | 0.0 /100 | #337 | Tragic 1.2% |
| Puget Sound Salish | 0.0 /100 | #338 | Tragic 1.2% |