Italian vs Tohono O'odham Doctorate Degree
COMPARE
Italian
Tohono O'odham
Doctorate Degree
Doctorate Degree Comparison
Italians
Tohono O'odham
2.0%
DOCTORATE DEGREE
86.0/ 100
METRIC RATING
142nd/ 347
METRIC RANK
1.5%
DOCTORATE DEGREE
0.4/ 100
METRIC RATING
281st/ 347
METRIC RANK
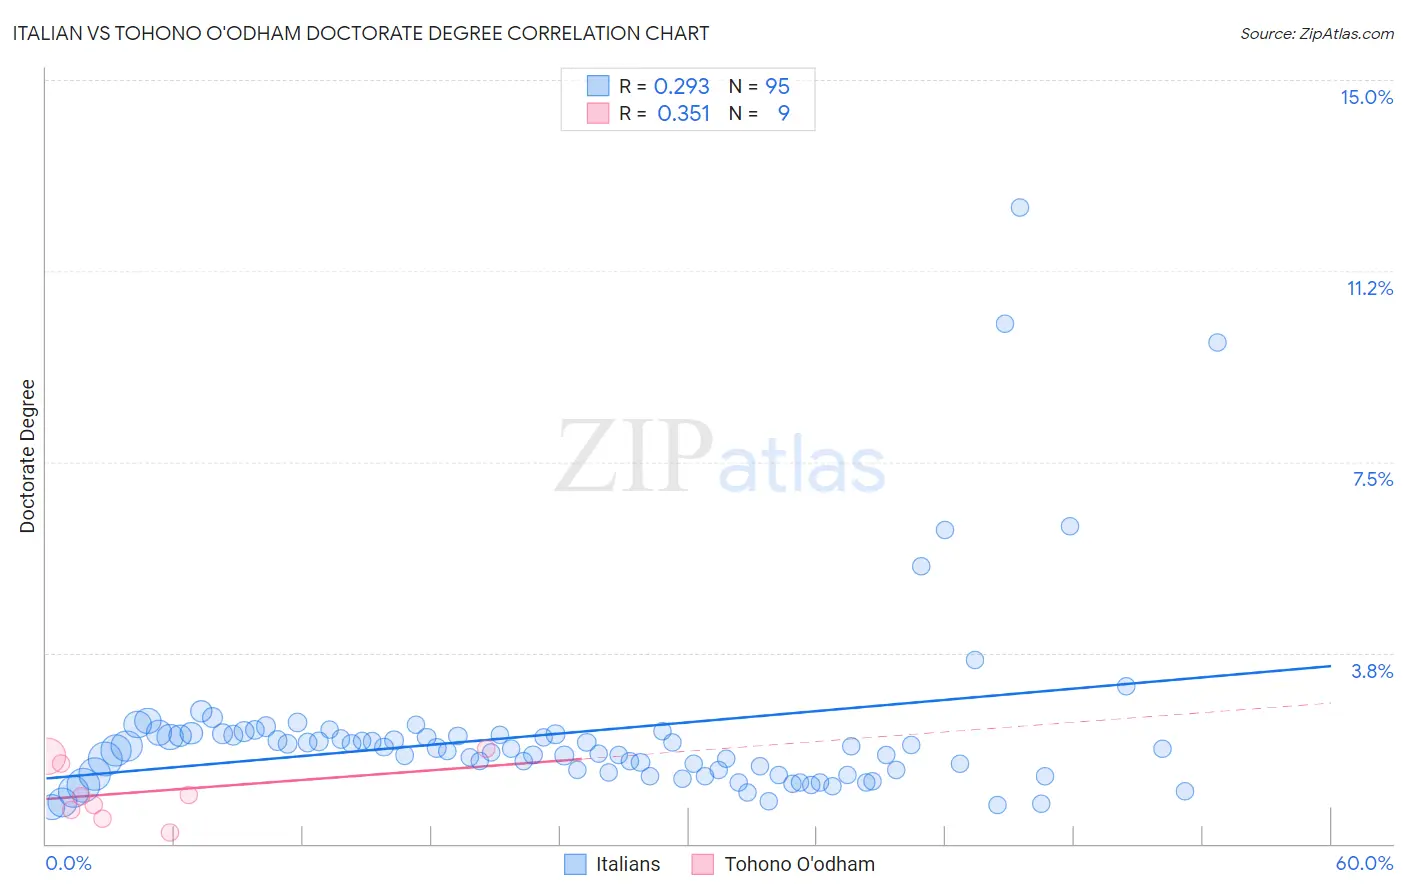
Italian vs Tohono O'odham Doctorate Degree Correlation Chart
The statistical analysis conducted on geographies consisting of 549,362,939 people shows a weak positive correlation between the proportion of Italians and percentage of population with at least doctorate degree education in the United States with a correlation coefficient (R) of 0.293 and weighted average of 2.0%. Similarly, the statistical analysis conducted on geographies consisting of 58,442,154 people shows a mild positive correlation between the proportion of Tohono O'odham and percentage of population with at least doctorate degree education in the United States with a correlation coefficient (R) of 0.351 and weighted average of 1.5%, a difference of 34.5%.
Doctorate Degree Correlation Summary
| Measurement | Italian | Tohono O'odham |
| Minimum | 0.72% | 0.23% |
| Maximum | 12.5% | 1.9% |
| Range | 11.8% | 1.6% |
| Mean | 2.2% | 1.0% |
| Median | 1.9% | 0.93% |
| Interquartile 25% (IQ1) | 1.4% | 0.58% |
| Interquartile 75% (IQ3) | 2.1% | 1.6% |
| Interquartile Range (IQR) | 0.77% | 1.1% |
| Standard Deviation (Sample) | 1.8% | 0.57% |
| Standard Deviation (Population) | 1.8% | 0.54% |
Similar Demographics by Doctorate Degree
Demographics Similar to Italians by Doctorate Degree
In terms of doctorate degree, the demographic groups most similar to Italians are Senegalese (2.0%, a difference of 0.21%), Sierra Leonean (2.0%, a difference of 0.25%), Immigrants from Africa (2.0%, a difference of 0.28%), Afghan (2.0%, a difference of 0.36%), and Immigrants from Moldova (2.0%, a difference of 0.46%).
| Demographics | Rating | Rank | Doctorate Degree |
| Serbians | 88.7 /100 | #135 | Excellent 2.0% |
| Swedes | 88.3 /100 | #136 | Excellent 2.0% |
| South American Indians | 88.3 /100 | #137 | Excellent 2.0% |
| Swiss | 88.0 /100 | #138 | Excellent 2.0% |
| Afghans | 87.2 /100 | #139 | Excellent 2.0% |
| Immigrants | Africa | 87.0 /100 | #140 | Excellent 2.0% |
| Senegalese | 86.7 /100 | #141 | Excellent 2.0% |
| Italians | 86.0 /100 | #142 | Excellent 2.0% |
| Sierra Leoneans | 85.1 /100 | #143 | Excellent 2.0% |
| Immigrants | Moldova | 84.3 /100 | #144 | Excellent 2.0% |
| Kenyans | 83.6 /100 | #145 | Excellent 1.9% |
| Immigrants | Syria | 83.6 /100 | #146 | Excellent 1.9% |
| Immigrants | Senegal | 82.5 /100 | #147 | Excellent 1.9% |
| Luxembourgers | 81.1 /100 | #148 | Excellent 1.9% |
| Basques | 76.9 /100 | #149 | Good 1.9% |
Demographics Similar to Tohono O'odham by Doctorate Degree
In terms of doctorate degree, the demographic groups most similar to Tohono O'odham are British West Indian (1.5%, a difference of 0.050%), Ecuadorian (1.5%, a difference of 0.060%), Marshallese (1.5%, a difference of 0.080%), Central American (1.5%, a difference of 0.10%), and Jamaican (1.5%, a difference of 0.14%).
| Demographics | Rating | Rank | Doctorate Degree |
| Yaqui | 0.4 /100 | #274 | Tragic 1.5% |
| Aleuts | 0.4 /100 | #275 | Tragic 1.5% |
| Paiute | 0.4 /100 | #276 | Tragic 1.5% |
| Bahamians | 0.4 /100 | #277 | Tragic 1.5% |
| Hawaiians | 0.4 /100 | #278 | Tragic 1.5% |
| Marshallese | 0.4 /100 | #279 | Tragic 1.5% |
| Ecuadorians | 0.4 /100 | #280 | Tragic 1.5% |
| Tohono O'odham | 0.4 /100 | #281 | Tragic 1.5% |
| British West Indians | 0.3 /100 | #282 | Tragic 1.5% |
| Central Americans | 0.3 /100 | #283 | Tragic 1.5% |
| Jamaicans | 0.3 /100 | #284 | Tragic 1.5% |
| Malaysians | 0.3 /100 | #285 | Tragic 1.5% |
| Cherokee | 0.3 /100 | #286 | Tragic 1.5% |
| Cajuns | 0.3 /100 | #287 | Tragic 1.5% |
| Immigrants | El Salvador | 0.3 /100 | #288 | Tragic 1.4% |