Italian vs Immigrants from Laos Doctorate Degree
COMPARE
Italian
Immigrants from Laos
Doctorate Degree
Doctorate Degree Comparison
Italians
Immigrants from Laos
2.0%
DOCTORATE DEGREE
86.0/ 100
METRIC RATING
142nd/ 347
METRIC RANK
1.4%
DOCTORATE DEGREE
0.1/ 100
METRIC RATING
308th/ 347
METRIC RANK
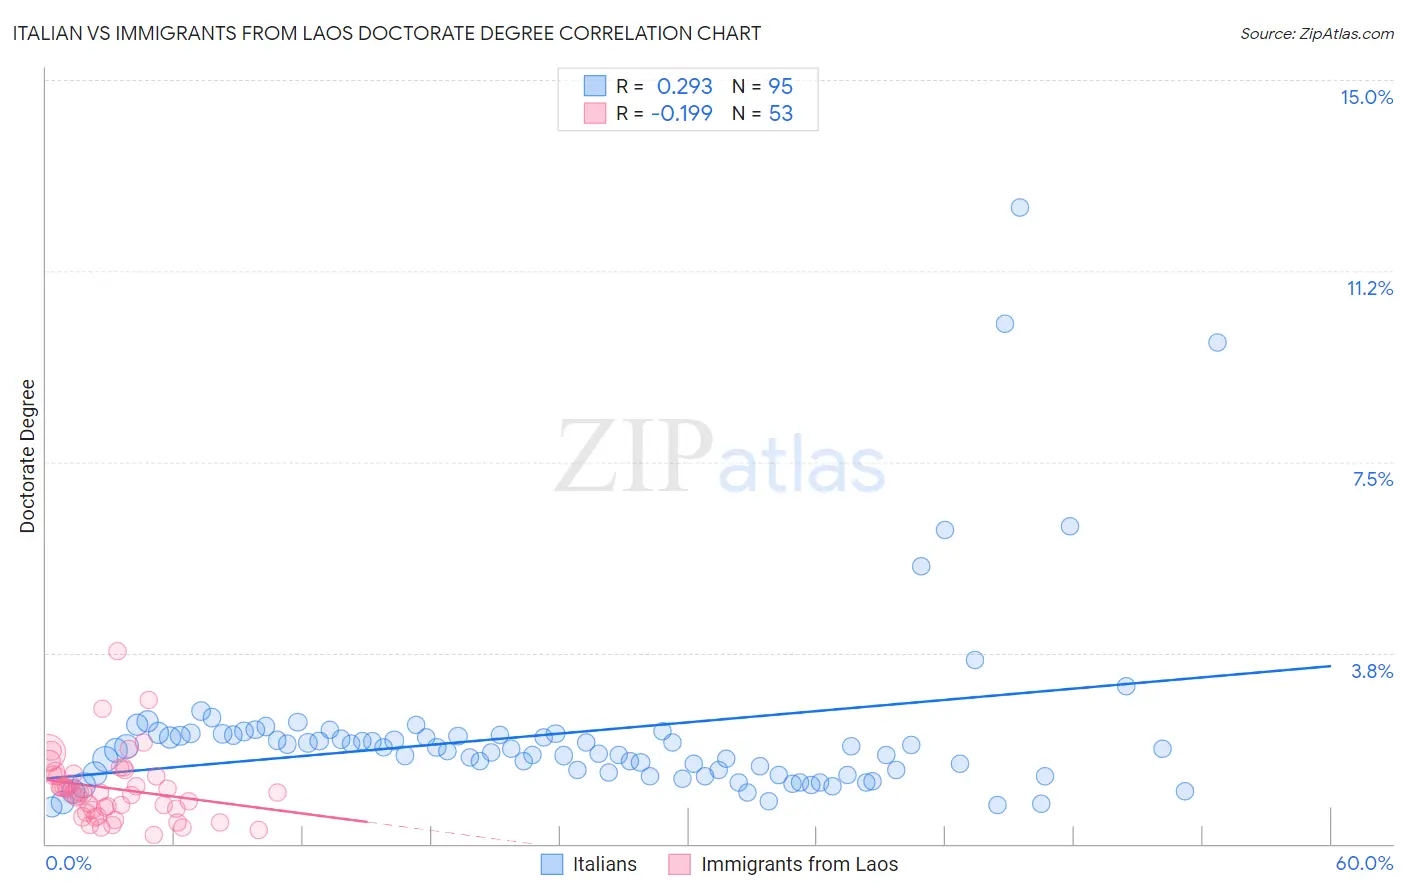
Italian vs Immigrants from Laos Doctorate Degree Correlation Chart
The statistical analysis conducted on geographies consisting of 549,362,939 people shows a weak positive correlation between the proportion of Italians and percentage of population with at least doctorate degree education in the United States with a correlation coefficient (R) of 0.293 and weighted average of 2.0%. Similarly, the statistical analysis conducted on geographies consisting of 200,482,890 people shows a poor negative correlation between the proportion of Immigrants from Laos and percentage of population with at least doctorate degree education in the United States with a correlation coefficient (R) of -0.199 and weighted average of 1.4%, a difference of 42.5%.
Doctorate Degree Correlation Summary
| Measurement | Italian | Immigrants from Laos |
| Minimum | 0.72% | 0.18% |
| Maximum | 12.5% | 3.8% |
| Range | 11.8% | 3.6% |
| Mean | 2.2% | 1.1% |
| Median | 1.9% | 1.00% |
| Interquartile 25% (IQ1) | 1.4% | 0.64% |
| Interquartile 75% (IQ3) | 2.1% | 1.4% |
| Interquartile Range (IQR) | 0.77% | 0.72% |
| Standard Deviation (Sample) | 1.8% | 0.67% |
| Standard Deviation (Population) | 1.8% | 0.67% |
Similar Demographics by Doctorate Degree
Demographics Similar to Italians by Doctorate Degree
In terms of doctorate degree, the demographic groups most similar to Italians are Senegalese (2.0%, a difference of 0.21%), Sierra Leonean (2.0%, a difference of 0.25%), Immigrants from Africa (2.0%, a difference of 0.28%), Afghan (2.0%, a difference of 0.36%), and Immigrants from Moldova (2.0%, a difference of 0.46%).
| Demographics | Rating | Rank | Doctorate Degree |
| Serbians | 88.7 /100 | #135 | Excellent 2.0% |
| Swedes | 88.3 /100 | #136 | Excellent 2.0% |
| South American Indians | 88.3 /100 | #137 | Excellent 2.0% |
| Swiss | 88.0 /100 | #138 | Excellent 2.0% |
| Afghans | 87.2 /100 | #139 | Excellent 2.0% |
| Immigrants | Africa | 87.0 /100 | #140 | Excellent 2.0% |
| Senegalese | 86.7 /100 | #141 | Excellent 2.0% |
| Italians | 86.0 /100 | #142 | Excellent 2.0% |
| Sierra Leoneans | 85.1 /100 | #143 | Excellent 2.0% |
| Immigrants | Moldova | 84.3 /100 | #144 | Excellent 2.0% |
| Kenyans | 83.6 /100 | #145 | Excellent 1.9% |
| Immigrants | Syria | 83.6 /100 | #146 | Excellent 1.9% |
| Immigrants | Senegal | 82.5 /100 | #147 | Excellent 1.9% |
| Luxembourgers | 81.1 /100 | #148 | Excellent 1.9% |
| Basques | 76.9 /100 | #149 | Good 1.9% |
Demographics Similar to Immigrants from Laos by Doctorate Degree
In terms of doctorate degree, the demographic groups most similar to Immigrants from Laos are Cuban (1.4%, a difference of 0.050%), Guyanese (1.4%, a difference of 0.30%), Pennsylvania German (1.4%, a difference of 0.31%), Immigrants from Grenada (1.4%, a difference of 0.41%), and Mexican American Indian (1.4%, a difference of 0.45%).
| Demographics | Rating | Rank | Doctorate Degree |
| Hondurans | 0.1 /100 | #301 | Tragic 1.4% |
| Shoshone | 0.1 /100 | #302 | Tragic 1.4% |
| Immigrants | Dominica | 0.1 /100 | #303 | Tragic 1.4% |
| Mexican American Indians | 0.1 /100 | #304 | Tragic 1.4% |
| Pennsylvania Germans | 0.1 /100 | #305 | Tragic 1.4% |
| Guyanese | 0.1 /100 | #306 | Tragic 1.4% |
| Cubans | 0.1 /100 | #307 | Tragic 1.4% |
| Immigrants | Laos | 0.1 /100 | #308 | Tragic 1.4% |
| Immigrants | Grenada | 0.1 /100 | #309 | Tragic 1.4% |
| Immigrants | Jamaica | 0.1 /100 | #310 | Tragic 1.4% |
| Immigrants | Honduras | 0.1 /100 | #311 | Tragic 1.4% |
| Immigrants | Nicaragua | 0.1 /100 | #312 | Tragic 1.4% |
| Menominee | 0.1 /100 | #313 | Tragic 1.4% |
| Dominicans | 0.1 /100 | #314 | Tragic 1.4% |
| Immigrants | Azores | 0.1 /100 | #315 | Tragic 1.4% |