Irish vs Alsatian No Schooling Completed
COMPARE
Irish
Alsatian
No Schooling Completed
No Schooling Completed Comparison
Irish
Alsatians
1.4%
NO SCHOOLING COMPLETED
100.0/ 100
METRIC RATING
12th/ 347
METRIC RANK
2.0%
NO SCHOOLING COMPLETED
79.1/ 100
METRIC RATING
144th/ 347
METRIC RANK
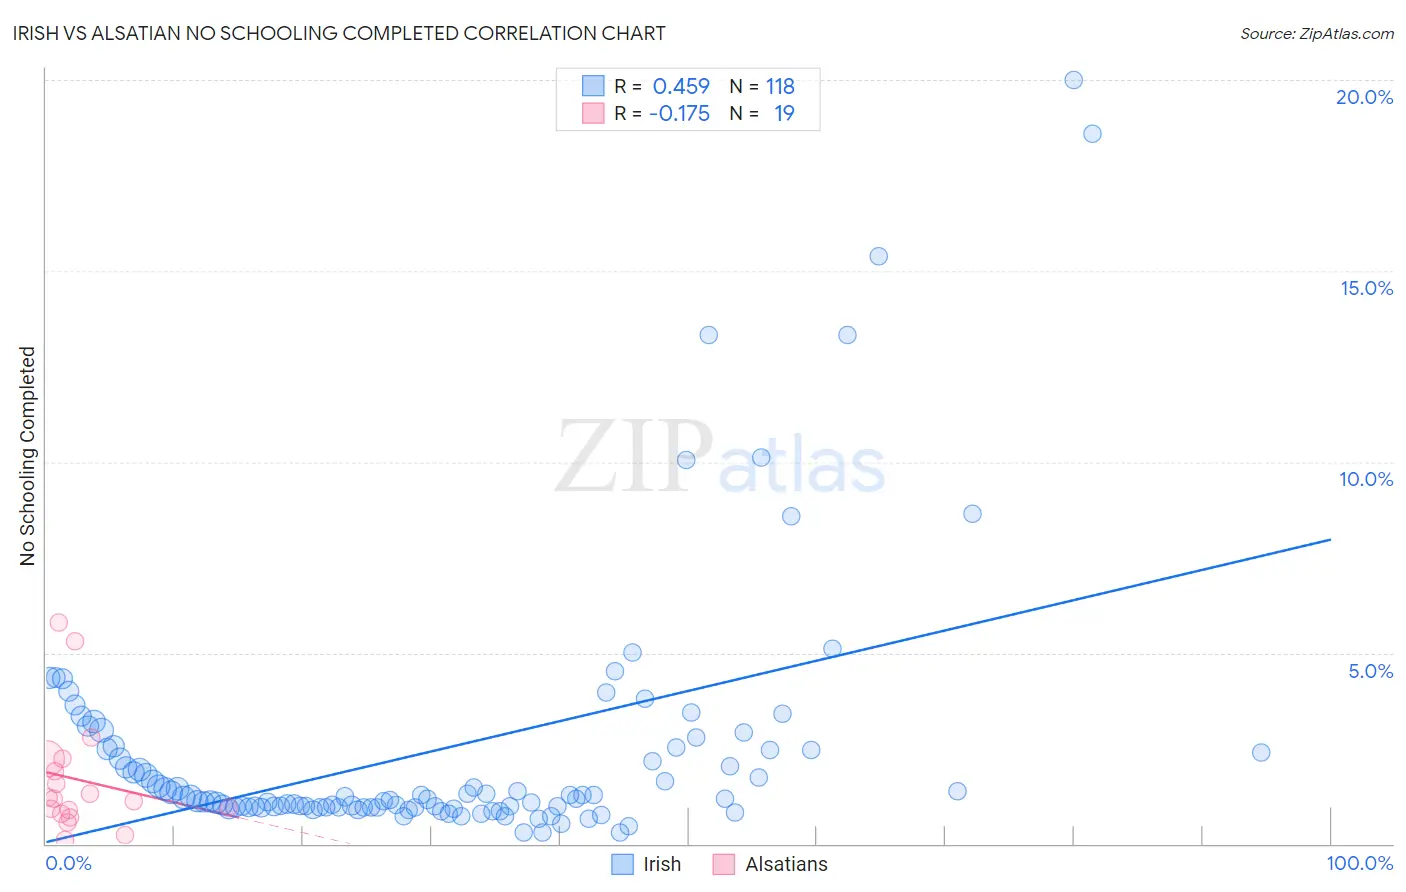
Irish vs Alsatian No Schooling Completed Correlation Chart
The statistical analysis conducted on geographies consisting of 558,904,841 people shows a moderate positive correlation between the proportion of Irish and percentage of population with no schooling in the United States with a correlation coefficient (R) of 0.459 and weighted average of 1.4%. Similarly, the statistical analysis conducted on geographies consisting of 82,371,288 people shows a poor negative correlation between the proportion of Alsatians and percentage of population with no schooling in the United States with a correlation coefficient (R) of -0.175 and weighted average of 2.0%, a difference of 39.0%.
No Schooling Completed Correlation Summary
| Measurement | Irish | Alsatian |
| Minimum | 0.30% | 0.10% |
| Maximum | 20.0% | 5.8% |
| Range | 19.7% | 5.7% |
| Mean | 2.5% | 1.7% |
| Median | 1.2% | 1.2% |
| Interquartile 25% (IQ1) | 0.96% | 0.80% |
| Interquartile 75% (IQ3) | 2.5% | 2.2% |
| Interquartile Range (IQR) | 1.5% | 1.4% |
| Standard Deviation (Sample) | 3.4% | 1.5% |
| Standard Deviation (Population) | 3.4% | 1.5% |
Similar Demographics by No Schooling Completed
Demographics Similar to Irish by No Schooling Completed
In terms of no schooling completed, the demographic groups most similar to Irish are Lithuanian (1.4%, a difference of 0.030%), Polish (1.4%, a difference of 0.030%), Dutch (1.4%, a difference of 0.86%), Scotch-Irish (1.5%, a difference of 0.97%), and Tlingit-Haida (1.5%, a difference of 1.0%).
| Demographics | Rating | Rank | No Schooling Completed |
| Slovenes | 100.0 /100 | #5 | Exceptional 1.4% |
| Carpatho Rusyns | 100.0 /100 | #6 | Exceptional 1.4% |
| English | 100.0 /100 | #7 | Exceptional 1.4% |
| Swedes | 100.0 /100 | #8 | Exceptional 1.4% |
| Scottish | 100.0 /100 | #9 | Exceptional 1.4% |
| Dutch | 100.0 /100 | #10 | Exceptional 1.4% |
| Lithuanians | 100.0 /100 | #11 | Exceptional 1.4% |
| Irish | 100.0 /100 | #12 | Exceptional 1.4% |
| Poles | 100.0 /100 | #13 | Exceptional 1.4% |
| Scotch-Irish | 100.0 /100 | #14 | Exceptional 1.5% |
| Tlingit-Haida | 100.0 /100 | #15 | Exceptional 1.5% |
| Finns | 100.0 /100 | #16 | Exceptional 1.5% |
| Croatians | 100.0 /100 | #17 | Exceptional 1.5% |
| Danes | 100.0 /100 | #18 | Exceptional 1.5% |
| Alaskan Athabascans | 100.0 /100 | #19 | Exceptional 1.5% |
Demographics Similar to Alsatians by No Schooling Completed
In terms of no schooling completed, the demographic groups most similar to Alsatians are Immigrants from Iran (2.0%, a difference of 0.010%), Immigrants from South Central Asia (2.0%, a difference of 0.20%), Immigrants from Moldova (2.0%, a difference of 0.22%), Soviet Union (2.0%, a difference of 0.40%), and Shoshone (2.0%, a difference of 0.48%).
| Demographics | Rating | Rank | No Schooling Completed |
| Filipinos | 85.5 /100 | #137 | Excellent 2.0% |
| Immigrants | Israel | 85.4 /100 | #138 | Excellent 2.0% |
| Jordanians | 84.5 /100 | #139 | Excellent 2.0% |
| Marshallese | 83.5 /100 | #140 | Excellent 2.0% |
| Immigrants | Greece | 83.5 /100 | #141 | Excellent 2.0% |
| Venezuelans | 81.5 /100 | #142 | Excellent 2.0% |
| Immigrants | South Central Asia | 80.0 /100 | #143 | Good 2.0% |
| Alsatians | 79.1 /100 | #144 | Good 2.0% |
| Immigrants | Iran | 79.0 /100 | #145 | Good 2.0% |
| Immigrants | Moldova | 78.0 /100 | #146 | Good 2.0% |
| Soviet Union | 77.1 /100 | #147 | Good 2.0% |
| Shoshone | 76.7 /100 | #148 | Good 2.0% |
| Immigrants | North Macedonia | 75.9 /100 | #149 | Good 2.0% |
| Blackfeet | 72.9 /100 | #150 | Good 2.0% |
| Immigrants | Jordan | 70.9 /100 | #151 | Good 2.0% |