Irish vs Central American No Schooling Completed
COMPARE
Irish
Central American
No Schooling Completed
No Schooling Completed Comparison
Irish
Central Americans
1.4%
NO SCHOOLING COMPLETED
100.0/ 100
METRIC RATING
12th/ 347
METRIC RANK
3.4%
NO SCHOOLING COMPLETED
0.0/ 100
METRIC RATING
332nd/ 347
METRIC RANK
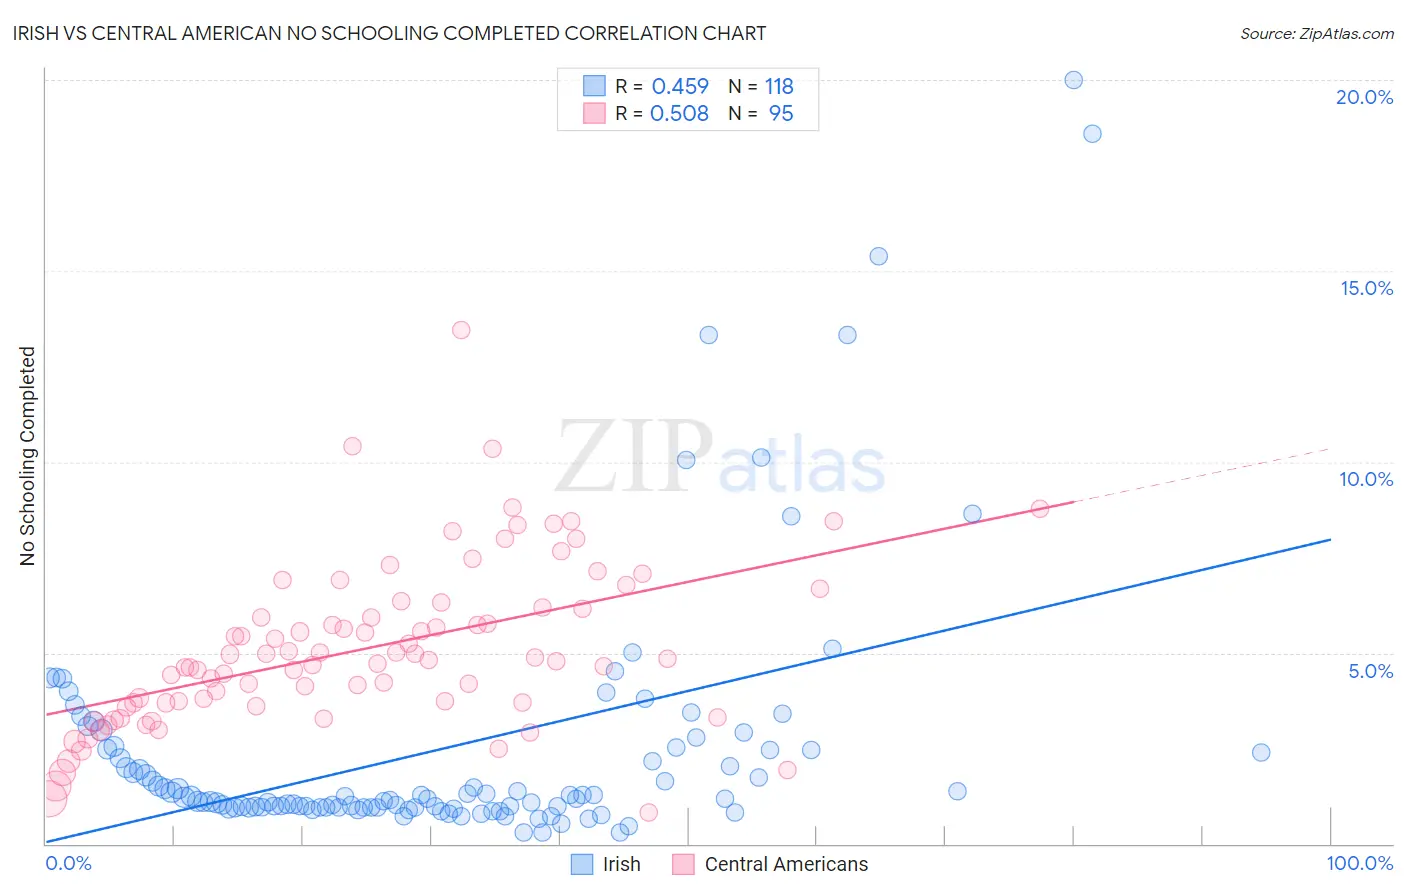
Irish vs Central American No Schooling Completed Correlation Chart
The statistical analysis conducted on geographies consisting of 558,904,841 people shows a moderate positive correlation between the proportion of Irish and percentage of population with no schooling in the United States with a correlation coefficient (R) of 0.459 and weighted average of 1.4%. Similarly, the statistical analysis conducted on geographies consisting of 497,423,122 people shows a substantial positive correlation between the proportion of Central Americans and percentage of population with no schooling in the United States with a correlation coefficient (R) of 0.508 and weighted average of 3.4%, a difference of 136.4%.
No Schooling Completed Correlation Summary
| Measurement | Irish | Central American |
| Minimum | 0.30% | 0.83% |
| Maximum | 20.0% | 13.5% |
| Range | 19.7% | 12.6% |
| Mean | 2.5% | 5.1% |
| Median | 1.2% | 4.8% |
| Interquartile 25% (IQ1) | 0.96% | 3.7% |
| Interquartile 75% (IQ3) | 2.5% | 6.2% |
| Interquartile Range (IQR) | 1.5% | 2.5% |
| Standard Deviation (Sample) | 3.4% | 2.2% |
| Standard Deviation (Population) | 3.4% | 2.1% |
Similar Demographics by No Schooling Completed
Demographics Similar to Irish by No Schooling Completed
In terms of no schooling completed, the demographic groups most similar to Irish are Lithuanian (1.4%, a difference of 0.030%), Polish (1.4%, a difference of 0.030%), Dutch (1.4%, a difference of 0.86%), Scotch-Irish (1.5%, a difference of 0.97%), and Tlingit-Haida (1.5%, a difference of 1.0%).
| Demographics | Rating | Rank | No Schooling Completed |
| Slovenes | 100.0 /100 | #5 | Exceptional 1.4% |
| Carpatho Rusyns | 100.0 /100 | #6 | Exceptional 1.4% |
| English | 100.0 /100 | #7 | Exceptional 1.4% |
| Swedes | 100.0 /100 | #8 | Exceptional 1.4% |
| Scottish | 100.0 /100 | #9 | Exceptional 1.4% |
| Dutch | 100.0 /100 | #10 | Exceptional 1.4% |
| Lithuanians | 100.0 /100 | #11 | Exceptional 1.4% |
| Irish | 100.0 /100 | #12 | Exceptional 1.4% |
| Poles | 100.0 /100 | #13 | Exceptional 1.4% |
| Scotch-Irish | 100.0 /100 | #14 | Exceptional 1.5% |
| Tlingit-Haida | 100.0 /100 | #15 | Exceptional 1.5% |
| Finns | 100.0 /100 | #16 | Exceptional 1.5% |
| Croatians | 100.0 /100 | #17 | Exceptional 1.5% |
| Danes | 100.0 /100 | #18 | Exceptional 1.5% |
| Alaskan Athabascans | 100.0 /100 | #19 | Exceptional 1.5% |
Demographics Similar to Central Americans by No Schooling Completed
In terms of no schooling completed, the demographic groups most similar to Central Americans are Immigrants from Dominican Republic (3.4%, a difference of 0.060%), Japanese (3.3%, a difference of 1.5%), Immigrants from Armenia (3.3%, a difference of 1.5%), Guatemalan (3.5%, a difference of 1.8%), and Immigrants from Vietnam (3.3%, a difference of 2.0%).
| Demographics | Rating | Rank | No Schooling Completed |
| Dominicans | 0.0 /100 | #325 | Tragic 3.2% |
| Indonesians | 0.0 /100 | #326 | Tragic 3.2% |
| Immigrants | Latin America | 0.0 /100 | #327 | Tragic 3.3% |
| Mexicans | 0.0 /100 | #328 | Tragic 3.3% |
| Immigrants | Vietnam | 0.0 /100 | #329 | Tragic 3.3% |
| Immigrants | Armenia | 0.0 /100 | #330 | Tragic 3.3% |
| Japanese | 0.0 /100 | #331 | Tragic 3.3% |
| Central Americans | 0.0 /100 | #332 | Tragic 3.4% |
| Immigrants | Dominican Republic | 0.0 /100 | #333 | Tragic 3.4% |
| Guatemalans | 0.0 /100 | #334 | Tragic 3.5% |
| Immigrants | Cambodia | 0.0 /100 | #335 | Tragic 3.5% |
| Immigrants | Fiji | 0.0 /100 | #336 | Tragic 3.5% |
| Immigrants | Cabo Verde | 0.0 /100 | #337 | Tragic 3.5% |
| Bangladeshis | 0.0 /100 | #338 | Tragic 3.5% |
| Yakama | 0.0 /100 | #339 | Tragic 3.6% |