Iranian vs Immigrants from Armenia College, Under 1 year
COMPARE
Iranian
Immigrants from Armenia
College, Under 1 year
College, Under 1 year Comparison
Iranians
Immigrants from Armenia
74.9%
COLLEGE, UNDER 1 YEAR
100.0/ 100
METRIC RATING
2nd/ 347
METRIC RANK
64.7%
COLLEGE, UNDER 1 YEAR
28.1/ 100
METRIC RATING
191st/ 347
METRIC RANK
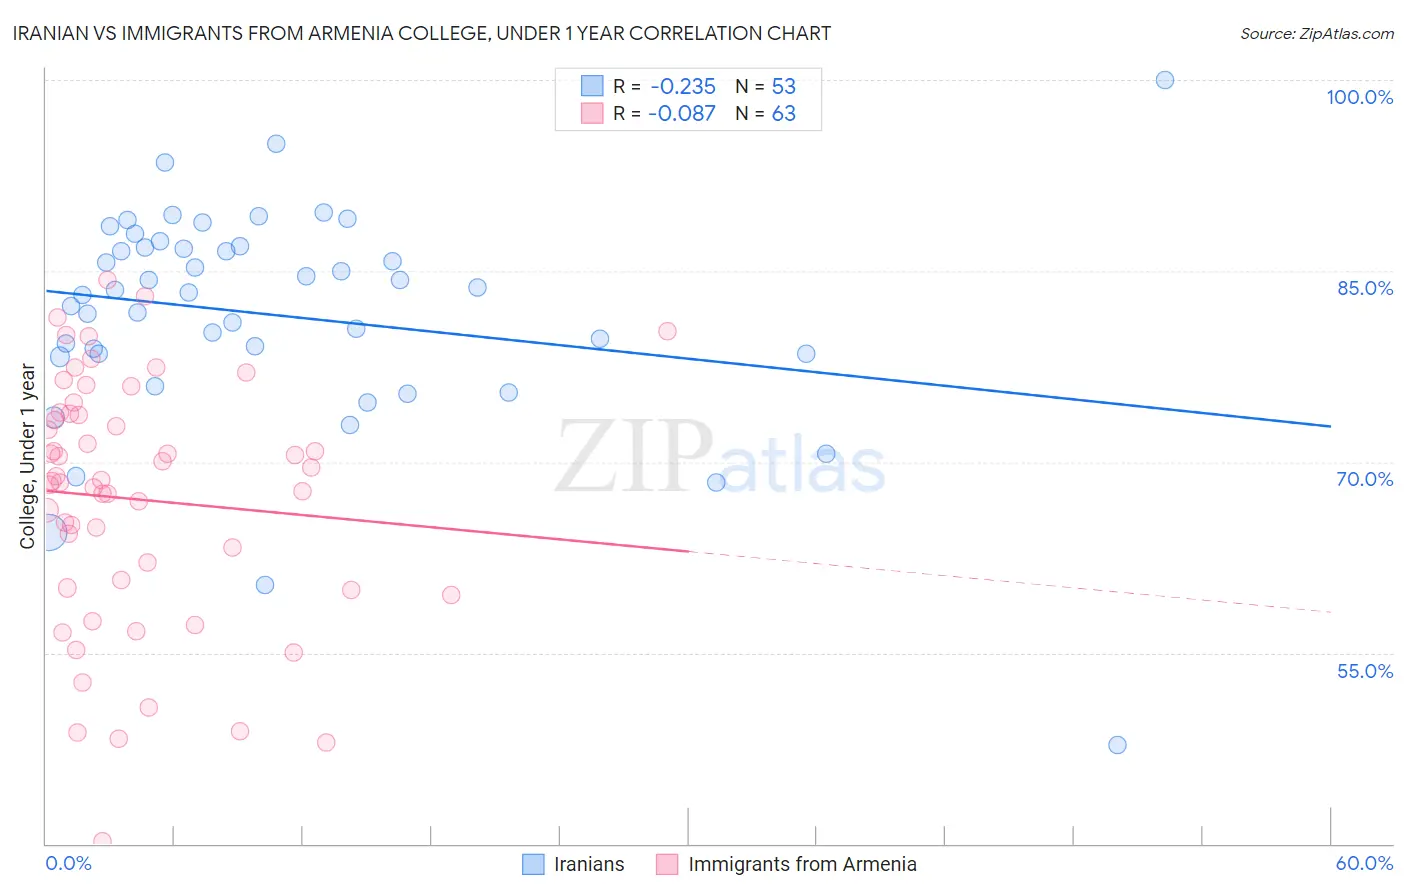
Iranian vs Immigrants from Armenia College, Under 1 year Correlation Chart
The statistical analysis conducted on geographies consisting of 316,900,663 people shows a weak negative correlation between the proportion of Iranians and percentage of population with at least college, under 1 year education in the United States with a correlation coefficient (R) of -0.235 and weighted average of 74.9%. Similarly, the statistical analysis conducted on geographies consisting of 97,725,183 people shows a slight negative correlation between the proportion of Immigrants from Armenia and percentage of population with at least college, under 1 year education in the United States with a correlation coefficient (R) of -0.087 and weighted average of 64.7%, a difference of 15.6%.
College, Under 1 year Correlation Summary
| Measurement | Iranian | Immigrants from Armenia |
| Minimum | 47.7% | 40.2% |
| Maximum | 100.0% | 84.3% |
| Range | 52.3% | 44.1% |
| Mean | 81.5% | 67.0% |
| Median | 83.3% | 68.4% |
| Interquartile 25% (IQ1) | 78.4% | 60.1% |
| Interquartile 75% (IQ3) | 86.9% | 73.8% |
| Interquartile Range (IQR) | 8.5% | 13.6% |
| Standard Deviation (Sample) | 8.8% | 9.7% |
| Standard Deviation (Population) | 8.8% | 9.7% |
Similar Demographics by College, Under 1 year
Demographics Similar to Iranians by College, Under 1 year
In terms of college, under 1 year, the demographic groups most similar to Iranians are Immigrants from Singapore (74.8%, a difference of 0.050%), Immigrants from India (74.4%, a difference of 0.56%), Immigrants from Iran (74.3%, a difference of 0.79%), Filipino (75.5%, a difference of 0.85%), and Immigrants from Taiwan (74.2%, a difference of 0.90%).
| Demographics | Rating | Rank | College, Under 1 year |
| Filipinos | 100.0 /100 | #1 | Exceptional 75.5% |
| Iranians | 100.0 /100 | #2 | Exceptional 74.9% |
| Immigrants | Singapore | 100.0 /100 | #3 | Exceptional 74.8% |
| Immigrants | India | 100.0 /100 | #4 | Exceptional 74.4% |
| Immigrants | Iran | 100.0 /100 | #5 | Exceptional 74.3% |
| Immigrants | Taiwan | 100.0 /100 | #6 | Exceptional 74.2% |
| Okinawans | 100.0 /100 | #7 | Exceptional 73.7% |
| Thais | 100.0 /100 | #8 | Exceptional 73.4% |
| Immigrants | Australia | 100.0 /100 | #9 | Exceptional 72.7% |
| Immigrants | Israel | 100.0 /100 | #10 | Exceptional 72.3% |
| Immigrants | South Central Asia | 100.0 /100 | #11 | Exceptional 72.1% |
| Immigrants | Sweden | 100.0 /100 | #12 | Exceptional 72.1% |
| Cypriots | 100.0 /100 | #13 | Exceptional 72.0% |
| Cambodians | 100.0 /100 | #14 | Exceptional 71.9% |
| Burmese | 100.0 /100 | #15 | Exceptional 71.9% |
Demographics Similar to Immigrants from Armenia by College, Under 1 year
In terms of college, under 1 year, the demographic groups most similar to Immigrants from Armenia are Immigrants from Thailand (64.7%, a difference of 0.060%), Slovak (64.7%, a difference of 0.070%), Immigrants from Philippines (64.8%, a difference of 0.11%), Spanish (64.9%, a difference of 0.19%), and Immigrants from Cameroon (64.6%, a difference of 0.20%).
| Demographics | Rating | Rank | College, Under 1 year |
| Bermudans | 42.0 /100 | #184 | Average 65.2% |
| Sri Lankans | 41.7 /100 | #185 | Average 65.2% |
| Immigrants | Sierra Leone | 39.7 /100 | #186 | Fair 65.1% |
| Immigrants | Southern Europe | 34.3 /100 | #187 | Fair 64.9% |
| Immigrants | Albania | 32.0 /100 | #188 | Fair 64.9% |
| Spanish | 31.6 /100 | #189 | Fair 64.9% |
| Immigrants | Philippines | 30.1 /100 | #190 | Fair 64.8% |
| Immigrants | Armenia | 28.1 /100 | #191 | Fair 64.7% |
| Immigrants | Thailand | 27.0 /100 | #192 | Fair 64.7% |
| Slovaks | 26.7 /100 | #193 | Fair 64.7% |
| Immigrants | Cameroon | 24.6 /100 | #194 | Fair 64.6% |
| Immigrants | South Eastern Asia | 22.1 /100 | #195 | Fair 64.5% |
| Tongans | 21.2 /100 | #196 | Fair 64.5% |
| Costa Ricans | 19.6 /100 | #197 | Poor 64.4% |
| Tsimshian | 17.9 /100 | #198 | Poor 64.3% |