Immigrants from Venezuela vs Native Hawaiian Bachelor's Degree
COMPARE
Immigrants from Venezuela
Native Hawaiian
Bachelor's Degree
Bachelor's Degree Comparison
Immigrants from Venezuela
Native Hawaiians
40.2%
BACHELOR'S DEGREE
92.9/ 100
METRIC RATING
128th/ 347
METRIC RANK
33.2%
BACHELOR'S DEGREE
0.7/ 100
METRIC RATING
254th/ 347
METRIC RANK
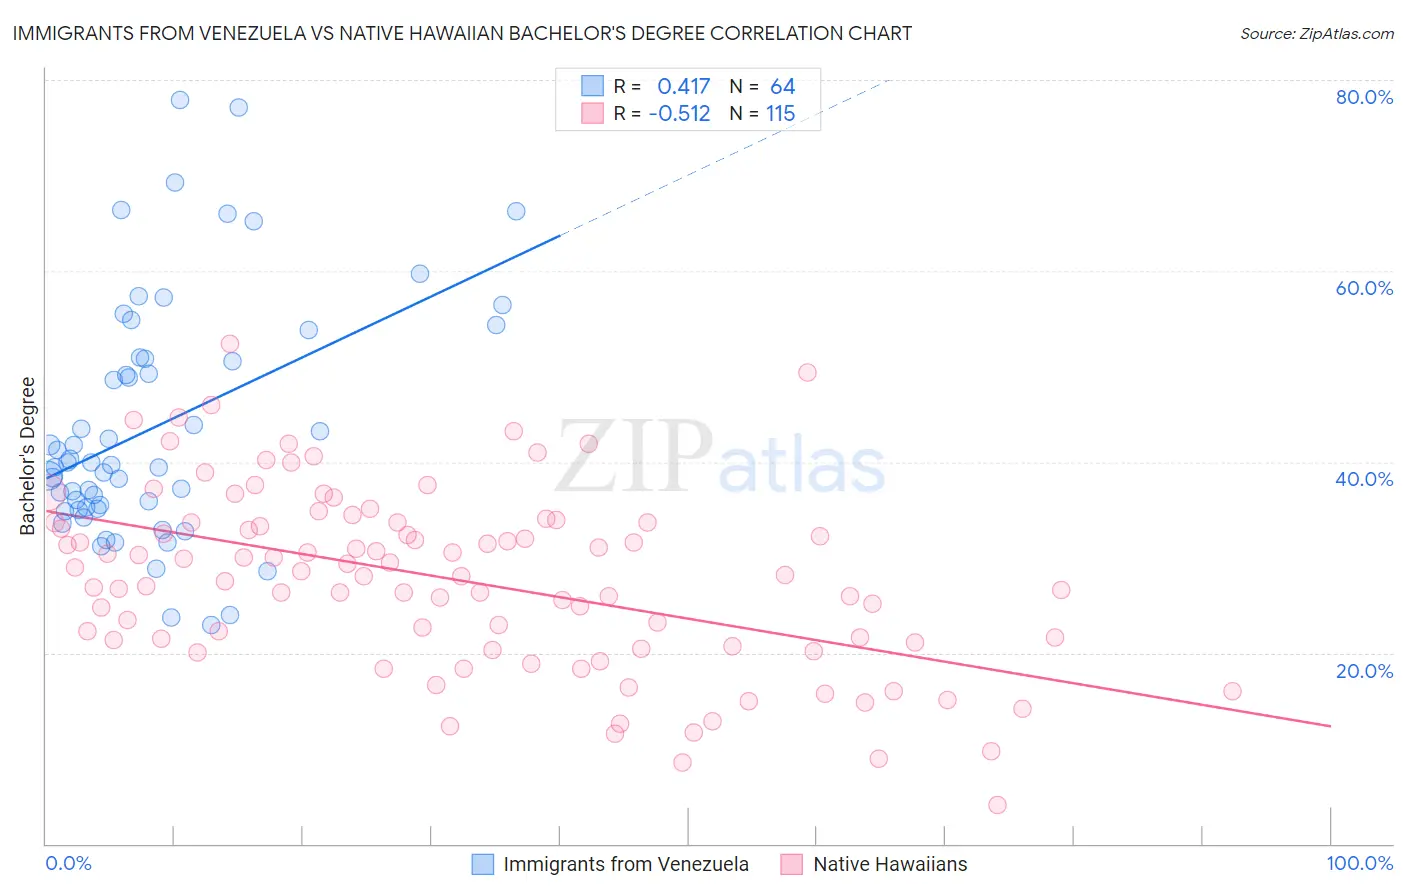
Immigrants from Venezuela vs Native Hawaiian Bachelor's Degree Correlation Chart
The statistical analysis conducted on geographies consisting of 287,853,697 people shows a moderate positive correlation between the proportion of Immigrants from Venezuela and percentage of population with at least bachelor's degree education in the United States with a correlation coefficient (R) of 0.417 and weighted average of 40.2%. Similarly, the statistical analysis conducted on geographies consisting of 332,091,621 people shows a substantial negative correlation between the proportion of Native Hawaiians and percentage of population with at least bachelor's degree education in the United States with a correlation coefficient (R) of -0.512 and weighted average of 33.2%, a difference of 21.0%.
Bachelor's Degree Correlation Summary
| Measurement | Immigrants from Venezuela | Native Hawaiian |
| Minimum | 22.9% | 4.0% |
| Maximum | 77.9% | 52.3% |
| Range | 55.1% | 48.3% |
| Mean | 43.7% | 27.7% |
| Median | 39.8% | 28.2% |
| Interquartile 25% (IQ1) | 35.2% | 21.1% |
| Interquartile 75% (IQ3) | 50.9% | 33.6% |
| Interquartile Range (IQR) | 15.7% | 12.5% |
| Standard Deviation (Sample) | 12.7% | 9.4% |
| Standard Deviation (Population) | 12.6% | 9.4% |
Similar Demographics by Bachelor's Degree
Demographics Similar to Immigrants from Venezuela by Bachelor's Degree
In terms of bachelor's degree, the demographic groups most similar to Immigrants from Venezuela are Immigrants from Jordan (40.3%, a difference of 0.17%), Serbian (40.1%, a difference of 0.17%), Sierra Leonean (40.1%, a difference of 0.24%), Italian (40.1%, a difference of 0.32%), and Immigrants from Eastern Africa (40.4%, a difference of 0.46%).
| Demographics | Rating | Rank | Bachelor's Degree |
| Moroccans | 94.6 /100 | #121 | Exceptional 40.5% |
| Immigrants | Albania | 94.4 /100 | #122 | Exceptional 40.4% |
| Lebanese | 94.3 /100 | #123 | Exceptional 40.4% |
| Immigrants | Eritrea | 94.3 /100 | #124 | Exceptional 40.4% |
| British | 94.2 /100 | #125 | Exceptional 40.4% |
| Immigrants | Eastern Africa | 94.1 /100 | #126 | Exceptional 40.4% |
| Immigrants | Jordan | 93.4 /100 | #127 | Exceptional 40.3% |
| Immigrants | Venezuela | 92.9 /100 | #128 | Exceptional 40.2% |
| Serbians | 92.4 /100 | #129 | Exceptional 40.1% |
| Sierra Leoneans | 92.2 /100 | #130 | Exceptional 40.1% |
| Italians | 91.9 /100 | #131 | Exceptional 40.1% |
| Taiwanese | 91.1 /100 | #132 | Exceptional 40.0% |
| Immigrants | Southern Europe | 91.1 /100 | #133 | Exceptional 40.0% |
| Assyrians/Chaldeans/Syriacs | 89.4 /100 | #134 | Excellent 39.8% |
| Luxembourgers | 89.1 /100 | #135 | Excellent 39.8% |
Demographics Similar to Native Hawaiians by Bachelor's Degree
In terms of bachelor's degree, the demographic groups most similar to Native Hawaiians are Iroquois (33.2%, a difference of 0.020%), U.S. Virgin Islander (33.2%, a difference of 0.060%), Nicaraguan (33.1%, a difference of 0.20%), Immigrants from Bahamas (33.3%, a difference of 0.27%), and Japanese (33.3%, a difference of 0.34%).
| Demographics | Rating | Rank | Bachelor's Degree |
| Immigrants | Congo | 1.0 /100 | #247 | Tragic 33.6% |
| Cree | 1.0 /100 | #248 | Tragic 33.6% |
| Immigrants | Liberia | 0.9 /100 | #249 | Tragic 33.5% |
| Indonesians | 0.9 /100 | #250 | Tragic 33.5% |
| Japanese | 0.7 /100 | #251 | Tragic 33.3% |
| Immigrants | Bahamas | 0.7 /100 | #252 | Tragic 33.3% |
| U.S. Virgin Islanders | 0.7 /100 | #253 | Tragic 33.2% |
| Native Hawaiians | 0.7 /100 | #254 | Tragic 33.2% |
| Iroquois | 0.7 /100 | #255 | Tragic 33.2% |
| Nicaraguans | 0.6 /100 | #256 | Tragic 33.1% |
| Spanish Americans | 0.6 /100 | #257 | Tragic 33.1% |
| French American Indians | 0.6 /100 | #258 | Tragic 33.1% |
| Osage | 0.5 /100 | #259 | Tragic 33.0% |
| Malaysians | 0.5 /100 | #260 | Tragic 32.9% |
| Africans | 0.5 /100 | #261 | Tragic 32.9% |