Iranian vs Choctaw Unemployment Among Women with Children Ages 6 to 17 years
COMPARE
Iranian
Choctaw
Unemployment Among Women with Children Ages 6 to 17 years
Unemployment Among Women with Children Ages 6 to 17 years Comparison
Iranians
Choctaw
8.0%
UNEMPLOYMENT AMONG WOMEN WITH CHILDREN AGES 6 TO 17 YEARS
100.0/ 100
METRIC RATING
41st/ 347
METRIC RANK
9.9%
UNEMPLOYMENT AMONG WOMEN WITH CHILDREN AGES 6 TO 17 YEARS
0.0/ 100
METRIC RATING
286th/ 347
METRIC RANK
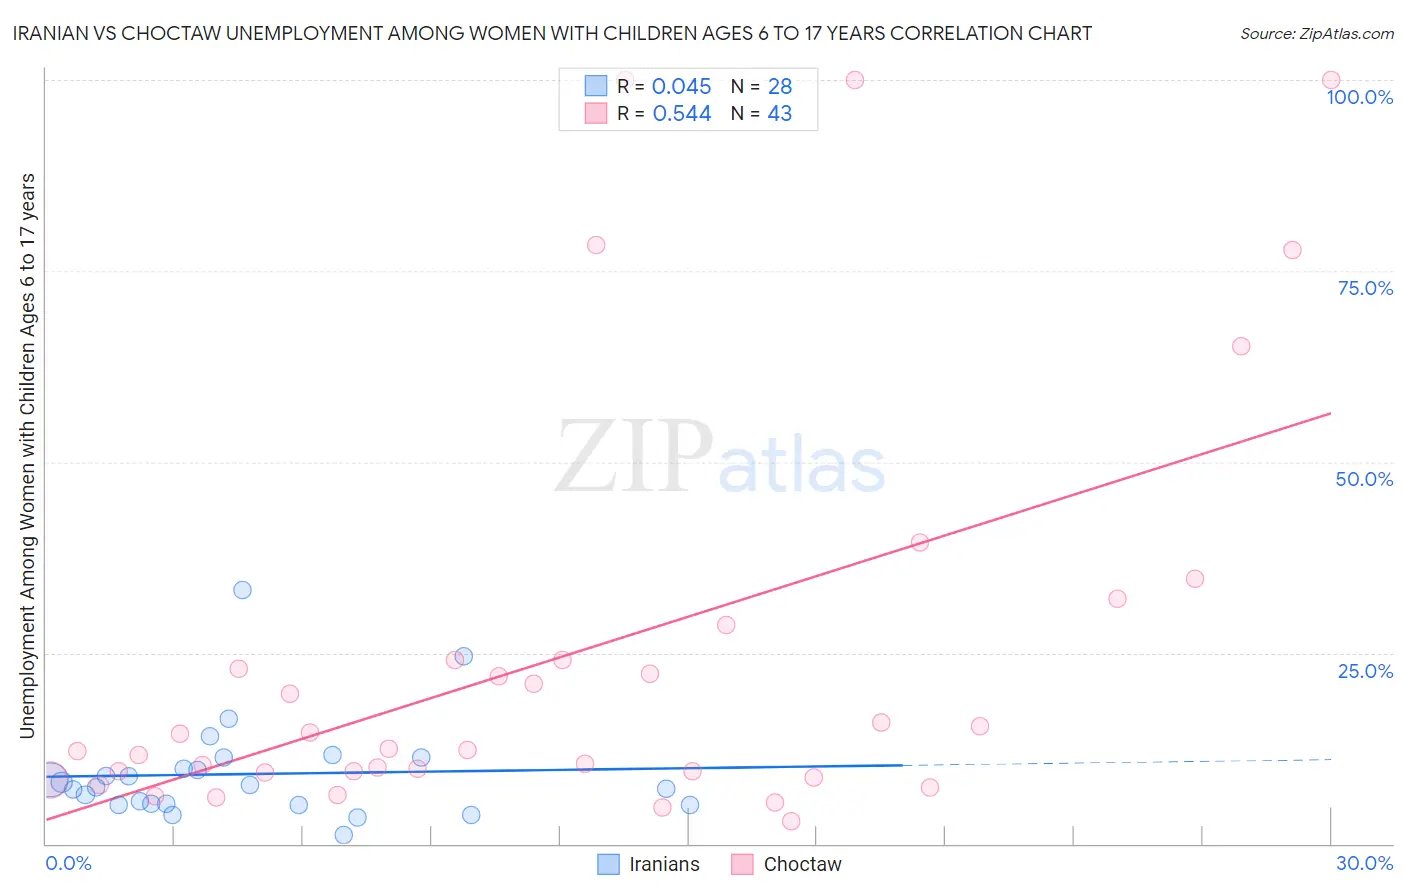
Iranian vs Choctaw Unemployment Among Women with Children Ages 6 to 17 years Correlation Chart
The statistical analysis conducted on geographies consisting of 238,016,726 people shows no correlation between the proportion of Iranians and unemployment rate among women with children between the ages 6 and 17 in the United States with a correlation coefficient (R) of 0.045 and weighted average of 8.0%. Similarly, the statistical analysis conducted on geographies consisting of 208,938,346 people shows a substantial positive correlation between the proportion of Choctaw and unemployment rate among women with children between the ages 6 and 17 in the United States with a correlation coefficient (R) of 0.544 and weighted average of 9.9%, a difference of 23.8%.
Unemployment Among Women with Children Ages 6 to 17 years Correlation Summary
| Measurement | Iranian | Choctaw |
| Minimum | 1.2% | 2.9% |
| Maximum | 33.2% | 100.0% |
| Range | 32.0% | 97.1% |
| Mean | 9.1% | 24.7% |
| Median | 7.6% | 12.5% |
| Interquartile 25% (IQ1) | 5.2% | 9.3% |
| Interquartile 75% (IQ3) | 10.6% | 24.1% |
| Interquartile Range (IQR) | 5.4% | 14.7% |
| Standard Deviation (Sample) | 6.6% | 27.1% |
| Standard Deviation (Population) | 6.5% | 26.8% |
Similar Demographics by Unemployment Among Women with Children Ages 6 to 17 years
Demographics Similar to Iranians by Unemployment Among Women with Children Ages 6 to 17 years
In terms of unemployment among women with children ages 6 to 17 years, the demographic groups most similar to Iranians are Immigrants from Zimbabwe (8.0%, a difference of 0.070%), Immigrants from Somalia (8.0%, a difference of 0.27%), Somali (8.0%, a difference of 0.36%), Bhutanese (8.1%, a difference of 0.41%), and Immigrants from Sweden (8.1%, a difference of 0.45%).
| Demographics | Rating | Rank | Unemployment Among Women with Children Ages 6 to 17 years |
| Native Hawaiians | 100.0 /100 | #34 | Exceptional 7.9% |
| Immigrants | South Central Asia | 100.0 /100 | #35 | Exceptional 7.9% |
| Burmese | 100.0 /100 | #36 | Exceptional 8.0% |
| Asians | 100.0 /100 | #37 | Exceptional 8.0% |
| Alsatians | 100.0 /100 | #38 | Exceptional 8.0% |
| Somalis | 100.0 /100 | #39 | Exceptional 8.0% |
| Immigrants | Zimbabwe | 100.0 /100 | #40 | Exceptional 8.0% |
| Iranians | 100.0 /100 | #41 | Exceptional 8.0% |
| Immigrants | Somalia | 100.0 /100 | #42 | Exceptional 8.0% |
| Bhutanese | 100.0 /100 | #43 | Exceptional 8.1% |
| Immigrants | Sweden | 100.0 /100 | #44 | Exceptional 8.1% |
| Immigrants | Bulgaria | 100.0 /100 | #45 | Exceptional 8.1% |
| Icelanders | 100.0 /100 | #46 | Exceptional 8.1% |
| Immigrants | Switzerland | 100.0 /100 | #47 | Exceptional 8.1% |
| Immigrants | Asia | 100.0 /100 | #48 | Exceptional 8.1% |
Demographics Similar to Choctaw by Unemployment Among Women with Children Ages 6 to 17 years
In terms of unemployment among women with children ages 6 to 17 years, the demographic groups most similar to Choctaw are Sierra Leonean (9.9%, a difference of 0.050%), Hispanic or Latino (9.9%, a difference of 0.12%), Shoshone (10.0%, a difference of 0.29%), Yakama (9.9%, a difference of 0.43%), and Central American Indian (9.9%, a difference of 0.58%).
| Demographics | Rating | Rank | Unemployment Among Women with Children Ages 6 to 17 years |
| Scotch-Irish | 0.1 /100 | #279 | Tragic 9.7% |
| Seminole | 0.1 /100 | #280 | Tragic 9.7% |
| Jamaicans | 0.0 /100 | #281 | Tragic 9.8% |
| Slovaks | 0.0 /100 | #282 | Tragic 9.8% |
| Central American Indians | 0.0 /100 | #283 | Tragic 9.9% |
| Yakama | 0.0 /100 | #284 | Tragic 9.9% |
| Hispanics or Latinos | 0.0 /100 | #285 | Tragic 9.9% |
| Choctaw | 0.0 /100 | #286 | Tragic 9.9% |
| Sierra Leoneans | 0.0 /100 | #287 | Tragic 9.9% |
| Shoshone | 0.0 /100 | #288 | Tragic 10.0% |
| Hondurans | 0.0 /100 | #289 | Tragic 10.0% |
| Sub-Saharan Africans | 0.0 /100 | #290 | Tragic 10.0% |
| Immigrants | Nonimmigrants | 0.0 /100 | #291 | Tragic 10.0% |
| Carpatho Rusyns | 0.0 /100 | #292 | Tragic 10.0% |
| Haitians | 0.0 /100 | #293 | Tragic 10.0% |