Immigrants from Saudi Arabia vs Choctaw 10th Grade
COMPARE
Immigrants from Saudi Arabia
Choctaw
10th Grade
10th Grade Comparison
Immigrants from Saudi Arabia
Choctaw
94.7%
10TH GRADE
99.0/ 100
METRIC RATING
87th/ 347
METRIC RANK
93.6%
10TH GRADE
36.6/ 100
METRIC RATING
184th/ 347
METRIC RANK
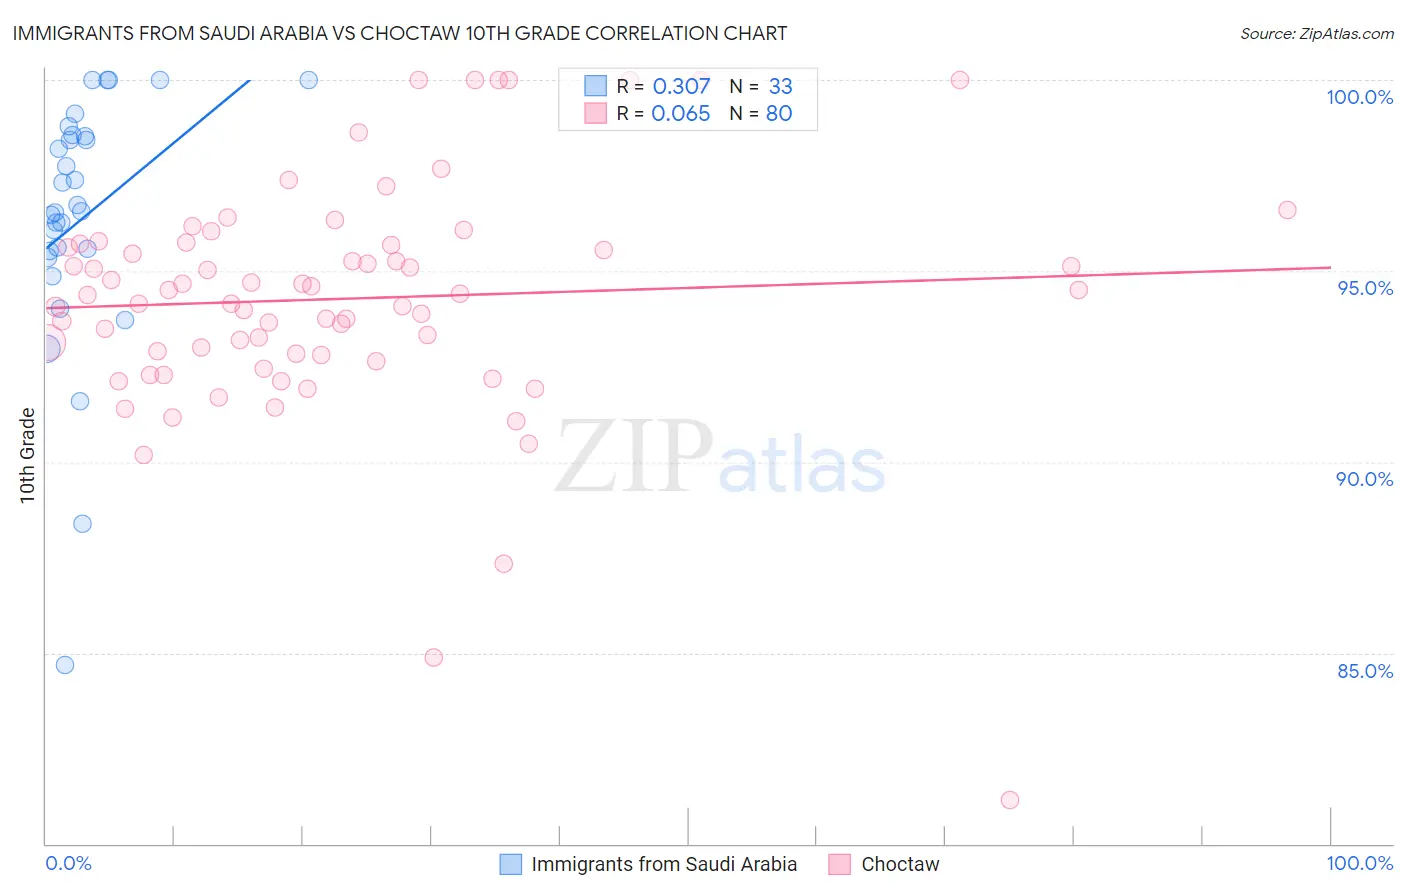
Immigrants from Saudi Arabia vs Choctaw 10th Grade Correlation Chart
The statistical analysis conducted on geographies consisting of 164,277,573 people shows a mild positive correlation between the proportion of Immigrants from Saudi Arabia and percentage of population with at least 10th grade education in the United States with a correlation coefficient (R) of 0.307 and weighted average of 94.7%. Similarly, the statistical analysis conducted on geographies consisting of 269,742,499 people shows a slight positive correlation between the proportion of Choctaw and percentage of population with at least 10th grade education in the United States with a correlation coefficient (R) of 0.065 and weighted average of 93.6%, a difference of 1.1%.
10th Grade Correlation Summary
| Measurement | Immigrants from Saudi Arabia | Choctaw |
| Minimum | 84.7% | 81.1% |
| Maximum | 100.0% | 100.0% |
| Range | 15.3% | 18.9% |
| Mean | 96.4% | 94.3% |
| Median | 96.6% | 94.4% |
| Interquartile 25% (IQ1) | 95.4% | 92.8% |
| Interquartile 75% (IQ3) | 98.5% | 95.7% |
| Interquartile Range (IQR) | 3.1% | 2.9% |
| Standard Deviation (Sample) | 3.3% | 3.1% |
| Standard Deviation (Population) | 3.3% | 3.1% |
Similar Demographics by 10th Grade
Demographics Similar to Immigrants from Saudi Arabia by 10th Grade
In terms of 10th grade, the demographic groups most similar to Immigrants from Saudi Arabia are Immigrants from Japan (94.7%, a difference of 0.0%), Crow (94.7%, a difference of 0.010%), Puget Sound Salish (94.7%, a difference of 0.010%), Immigrants from Western Europe (94.7%, a difference of 0.020%), and Icelander (94.7%, a difference of 0.020%).
| Demographics | Rating | Rank | 10th Grade |
| Immigrants | Denmark | 99.2 /100 | #80 | Exceptional 94.7% |
| Immigrants | Latvia | 99.2 /100 | #81 | Exceptional 94.7% |
| Swiss | 99.1 /100 | #82 | Exceptional 94.7% |
| Immigrants | Western Europe | 99.1 /100 | #83 | Exceptional 94.7% |
| Icelanders | 99.1 /100 | #84 | Exceptional 94.7% |
| Crow | 99.0 /100 | #85 | Exceptional 94.7% |
| Puget Sound Salish | 99.0 /100 | #86 | Exceptional 94.7% |
| Immigrants | Saudi Arabia | 99.0 /100 | #87 | Exceptional 94.7% |
| Immigrants | Japan | 99.0 /100 | #88 | Exceptional 94.7% |
| Immigrants | Moldova | 98.9 /100 | #89 | Exceptional 94.7% |
| South Africans | 98.8 /100 | #90 | Exceptional 94.7% |
| Whites/Caucasians | 98.8 /100 | #91 | Exceptional 94.7% |
| Yugoslavians | 98.4 /100 | #92 | Exceptional 94.6% |
| Soviet Union | 98.3 /100 | #93 | Exceptional 94.6% |
| Immigrants | Germany | 98.3 /100 | #94 | Exceptional 94.6% |
Demographics Similar to Choctaw by 10th Grade
In terms of 10th grade, the demographic groups most similar to Choctaw are Guamanian/Chamorro (93.6%, a difference of 0.0%), Sudanese (93.6%, a difference of 0.0%), Colville (93.6%, a difference of 0.020%), Immigrants from Eastern Asia (93.6%, a difference of 0.020%), and Liberian (93.6%, a difference of 0.020%).
| Demographics | Rating | Rank | 10th Grade |
| Immigrants | Lebanon | 47.1 /100 | #177 | Average 93.7% |
| Sierra Leoneans | 46.1 /100 | #178 | Average 93.7% |
| Paraguayans | 45.3 /100 | #179 | Average 93.7% |
| Blackfeet | 42.8 /100 | #180 | Average 93.7% |
| Immigrants | Northern Africa | 41.6 /100 | #181 | Average 93.7% |
| Colville | 38.8 /100 | #182 | Fair 93.6% |
| Guamanians/Chamorros | 37.1 /100 | #183 | Fair 93.6% |
| Choctaw | 36.6 /100 | #184 | Fair 93.6% |
| Sudanese | 36.6 /100 | #185 | Fair 93.6% |
| Immigrants | Eastern Asia | 35.1 /100 | #186 | Fair 93.6% |
| Liberians | 34.7 /100 | #187 | Fair 93.6% |
| Marshallese | 33.2 /100 | #188 | Fair 93.6% |
| Immigrants | Pakistan | 32.5 /100 | #189 | Fair 93.6% |
| Laotians | 32.1 /100 | #190 | Fair 93.6% |
| Yup'ik | 31.1 /100 | #191 | Fair 93.6% |