Immigrants from Bahamas vs Choctaw 10th Grade
COMPARE
Immigrants from Bahamas
Choctaw
10th Grade
10th Grade Comparison
Immigrants from Bahamas
Choctaw
93.4%
10TH GRADE
15.2/ 100
METRIC RATING
214th/ 347
METRIC RANK
93.6%
10TH GRADE
36.6/ 100
METRIC RATING
184th/ 347
METRIC RANK
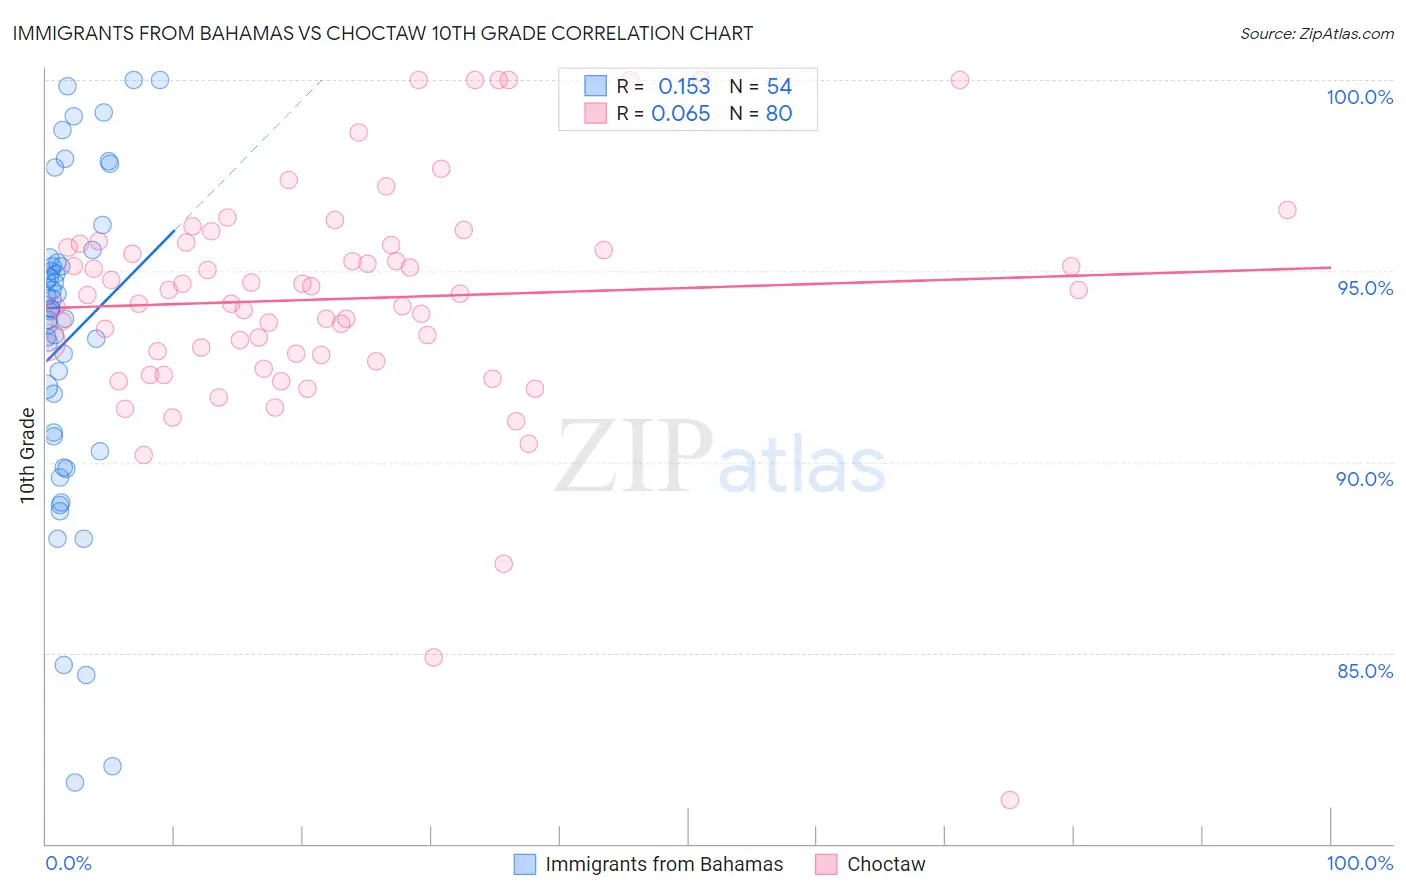
Immigrants from Bahamas vs Choctaw 10th Grade Correlation Chart
The statistical analysis conducted on geographies consisting of 104,668,036 people shows a poor positive correlation between the proportion of Immigrants from Bahamas and percentage of population with at least 10th grade education in the United States with a correlation coefficient (R) of 0.153 and weighted average of 93.4%. Similarly, the statistical analysis conducted on geographies consisting of 269,742,499 people shows a slight positive correlation between the proportion of Choctaw and percentage of population with at least 10th grade education in the United States with a correlation coefficient (R) of 0.065 and weighted average of 93.6%, a difference of 0.26%.
10th Grade Correlation Summary
| Measurement | Immigrants from Bahamas | Choctaw |
| Minimum | 81.6% | 81.1% |
| Maximum | 100.0% | 100.0% |
| Range | 18.4% | 18.9% |
| Mean | 93.2% | 94.3% |
| Median | 94.0% | 94.4% |
| Interquartile 25% (IQ1) | 90.7% | 92.8% |
| Interquartile 75% (IQ3) | 95.2% | 95.7% |
| Interquartile Range (IQR) | 4.5% | 2.9% |
| Standard Deviation (Sample) | 4.2% | 3.1% |
| Standard Deviation (Population) | 4.2% | 3.1% |
Similar Demographics by 10th Grade
Demographics Similar to Immigrants from Bahamas by 10th Grade
In terms of 10th grade, the demographic groups most similar to Immigrants from Bahamas are Immigrants from Oceania (93.4%, a difference of 0.0%), Immigrants from Asia (93.4%, a difference of 0.010%), Immigrants from Eastern Africa (93.4%, a difference of 0.010%), Immigrants from Zaire (93.4%, a difference of 0.020%), and Cajun (93.4%, a difference of 0.030%).
| Demographics | Rating | Rank | 10th Grade |
| Samoans | 19.5 /100 | #207 | Poor 93.4% |
| Immigrants | Syria | 19.4 /100 | #208 | Poor 93.4% |
| Immigrants | Chile | 18.8 /100 | #209 | Poor 93.4% |
| Indians (Asian) | 17.6 /100 | #210 | Poor 93.4% |
| Cajuns | 16.9 /100 | #211 | Poor 93.4% |
| Immigrants | Zaire | 16.7 /100 | #212 | Poor 93.4% |
| Immigrants | Asia | 15.7 /100 | #213 | Poor 93.4% |
| Immigrants | Bahamas | 15.2 /100 | #214 | Poor 93.4% |
| Immigrants | Oceania | 15.1 /100 | #215 | Poor 93.4% |
| Immigrants | Eastern Africa | 14.7 /100 | #216 | Poor 93.4% |
| Portuguese | 12.1 /100 | #217 | Poor 93.3% |
| Immigrants | Liberia | 10.2 /100 | #218 | Poor 93.3% |
| Seminole | 10.2 /100 | #219 | Poor 93.3% |
| Tongans | 9.5 /100 | #220 | Tragic 93.3% |
| Immigrants | Southern Europe | 8.9 /100 | #221 | Tragic 93.2% |
Demographics Similar to Choctaw by 10th Grade
In terms of 10th grade, the demographic groups most similar to Choctaw are Guamanian/Chamorro (93.6%, a difference of 0.0%), Sudanese (93.6%, a difference of 0.0%), Colville (93.6%, a difference of 0.020%), Immigrants from Eastern Asia (93.6%, a difference of 0.020%), and Liberian (93.6%, a difference of 0.020%).
| Demographics | Rating | Rank | 10th Grade |
| Immigrants | Lebanon | 47.1 /100 | #177 | Average 93.7% |
| Sierra Leoneans | 46.1 /100 | #178 | Average 93.7% |
| Paraguayans | 45.3 /100 | #179 | Average 93.7% |
| Blackfeet | 42.8 /100 | #180 | Average 93.7% |
| Immigrants | Northern Africa | 41.6 /100 | #181 | Average 93.7% |
| Colville | 38.8 /100 | #182 | Fair 93.6% |
| Guamanians/Chamorros | 37.1 /100 | #183 | Fair 93.6% |
| Choctaw | 36.6 /100 | #184 | Fair 93.6% |
| Sudanese | 36.6 /100 | #185 | Fair 93.6% |
| Immigrants | Eastern Asia | 35.1 /100 | #186 | Fair 93.6% |
| Liberians | 34.7 /100 | #187 | Fair 93.6% |
| Marshallese | 33.2 /100 | #188 | Fair 93.6% |
| Immigrants | Pakistan | 32.5 /100 | #189 | Fair 93.6% |
| Laotians | 32.1 /100 | #190 | Fair 93.6% |
| Yup'ik | 31.1 /100 | #191 | Fair 93.6% |