Inupiat vs Malaysian Bachelor's Degree
COMPARE
Inupiat
Malaysian
Bachelor's Degree
Bachelor's Degree Comparison
Inupiat
Malaysians
25.8%
BACHELOR'S DEGREE
0.0/ 100
METRIC RATING
337th/ 347
METRIC RANK
32.9%
BACHELOR'S DEGREE
0.5/ 100
METRIC RATING
260th/ 347
METRIC RANK
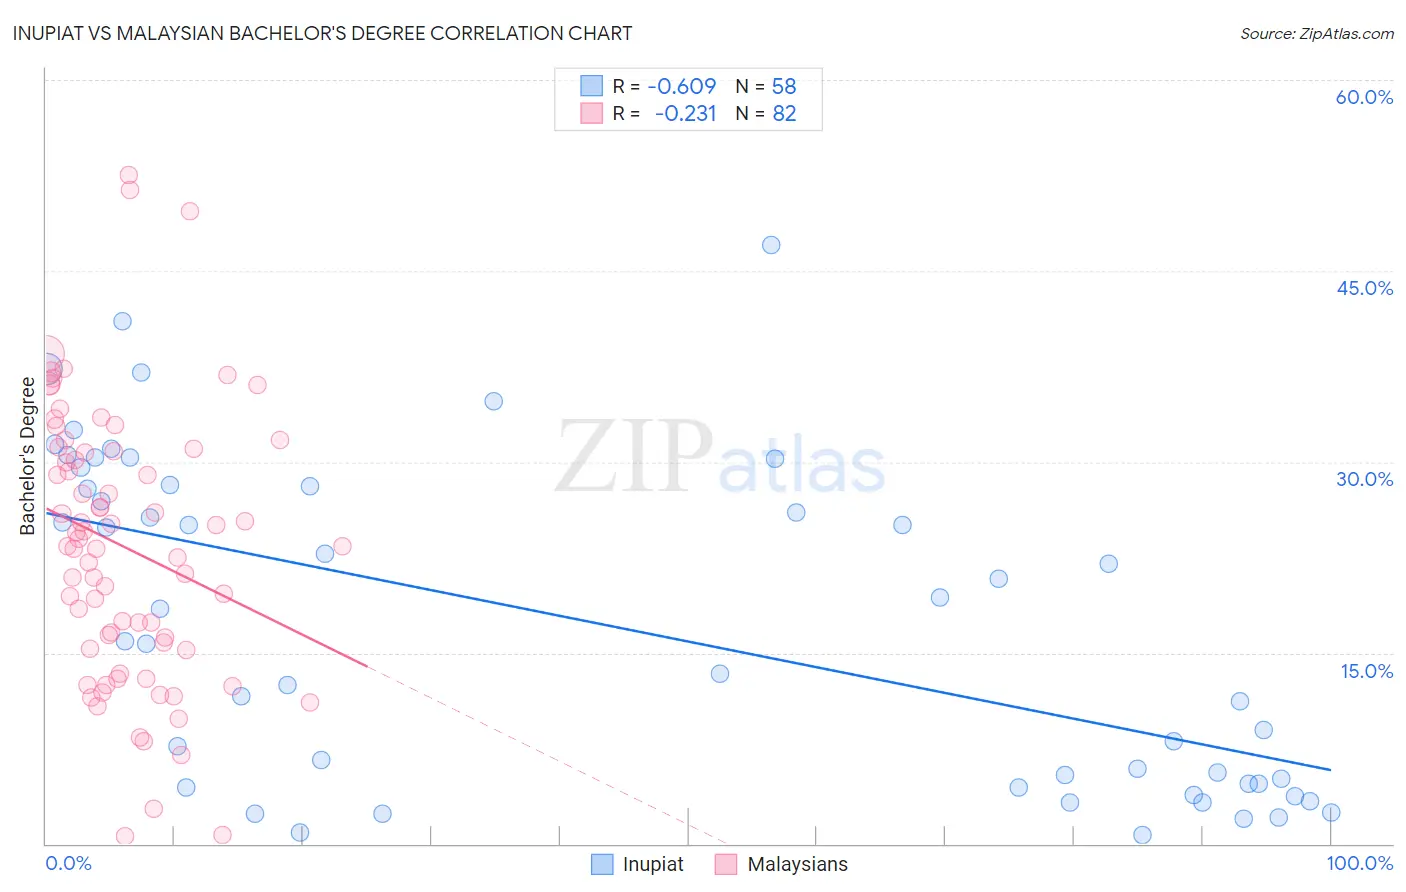
Inupiat vs Malaysian Bachelor's Degree Correlation Chart
The statistical analysis conducted on geographies consisting of 96,347,168 people shows a significant negative correlation between the proportion of Inupiat and percentage of population with at least bachelor's degree education in the United States with a correlation coefficient (R) of -0.609 and weighted average of 25.8%. Similarly, the statistical analysis conducted on geographies consisting of 226,101,467 people shows a weak negative correlation between the proportion of Malaysians and percentage of population with at least bachelor's degree education in the United States with a correlation coefficient (R) of -0.231 and weighted average of 32.9%, a difference of 27.6%.
Bachelor's Degree Correlation Summary
| Measurement | Inupiat | Malaysian |
| Minimum | 0.66% | 0.56% |
| Maximum | 47.0% | 52.5% |
| Range | 46.4% | 51.9% |
| Mean | 17.1% | 23.3% |
| Median | 15.8% | 23.4% |
| Interquartile 25% (IQ1) | 4.7% | 15.3% |
| Interquartile 75% (IQ3) | 28.1% | 30.9% |
| Interquartile Range (IQR) | 23.4% | 15.6% |
| Standard Deviation (Sample) | 12.7% | 10.7% |
| Standard Deviation (Population) | 12.6% | 10.7% |
Similar Demographics by Bachelor's Degree
Demographics Similar to Inupiat by Bachelor's Degree
In terms of bachelor's degree, the demographic groups most similar to Inupiat are Pueblo (25.5%, a difference of 1.1%), Immigrants from Mexico (26.1%, a difference of 1.3%), Native/Alaskan (26.3%, a difference of 2.0%), Hopi (25.3%, a difference of 2.0%), and Arapaho (26.6%, a difference of 3.2%).
| Demographics | Rating | Rank | Bachelor's Degree |
| Spanish American Indians | 0.0 /100 | #330 | Tragic 27.5% |
| Immigrants | Azores | 0.0 /100 | #331 | Tragic 27.3% |
| Menominee | 0.0 /100 | #332 | Tragic 27.3% |
| Mexicans | 0.0 /100 | #333 | Tragic 27.1% |
| Arapaho | 0.0 /100 | #334 | Tragic 26.6% |
| Natives/Alaskans | 0.0 /100 | #335 | Tragic 26.3% |
| Immigrants | Mexico | 0.0 /100 | #336 | Tragic 26.1% |
| Inupiat | 0.0 /100 | #337 | Tragic 25.8% |
| Pueblo | 0.0 /100 | #338 | Tragic 25.5% |
| Hopi | 0.0 /100 | #339 | Tragic 25.3% |
| Lumbee | 0.0 /100 | #340 | Tragic 24.8% |
| Yuman | 0.0 /100 | #341 | Tragic 24.5% |
| Yakama | 0.0 /100 | #342 | Tragic 24.5% |
| Tohono O'odham | 0.0 /100 | #343 | Tragic 24.4% |
| Navajo | 0.0 /100 | #344 | Tragic 23.6% |
Demographics Similar to Malaysians by Bachelor's Degree
In terms of bachelor's degree, the demographic groups most similar to Malaysians are African (32.9%, a difference of 0.090%), Immigrants from Jamaica (32.9%, a difference of 0.090%), Osage (33.0%, a difference of 0.36%), Belizean (32.8%, a difference of 0.38%), and French American Indian (33.1%, a difference of 0.41%).
| Demographics | Rating | Rank | Bachelor's Degree |
| U.S. Virgin Islanders | 0.7 /100 | #253 | Tragic 33.2% |
| Native Hawaiians | 0.7 /100 | #254 | Tragic 33.2% |
| Iroquois | 0.7 /100 | #255 | Tragic 33.2% |
| Nicaraguans | 0.6 /100 | #256 | Tragic 33.1% |
| Spanish Americans | 0.6 /100 | #257 | Tragic 33.1% |
| French American Indians | 0.6 /100 | #258 | Tragic 33.1% |
| Osage | 0.5 /100 | #259 | Tragic 33.0% |
| Malaysians | 0.5 /100 | #260 | Tragic 32.9% |
| Africans | 0.5 /100 | #261 | Tragic 32.9% |
| Immigrants | Jamaica | 0.5 /100 | #262 | Tragic 32.9% |
| Belizeans | 0.4 /100 | #263 | Tragic 32.8% |
| Central American Indians | 0.3 /100 | #264 | Tragic 32.5% |
| Bahamians | 0.3 /100 | #265 | Tragic 32.5% |
| Immigrants | Dominica | 0.3 /100 | #266 | Tragic 32.5% |
| Cubans | 0.3 /100 | #267 | Tragic 32.5% |