Inupiat vs Immigrants from Cabo Verde 7th Grade
COMPARE
Inupiat
Immigrants from Cabo Verde
7th Grade
7th Grade Comparison
Inupiat
Immigrants from Cabo Verde
97.4%
7TH GRADE
100.0/ 100
METRIC RATING
21st/ 347
METRIC RANK
93.1%
7TH GRADE
0.0/ 100
METRIC RATING
327th/ 347
METRIC RANK
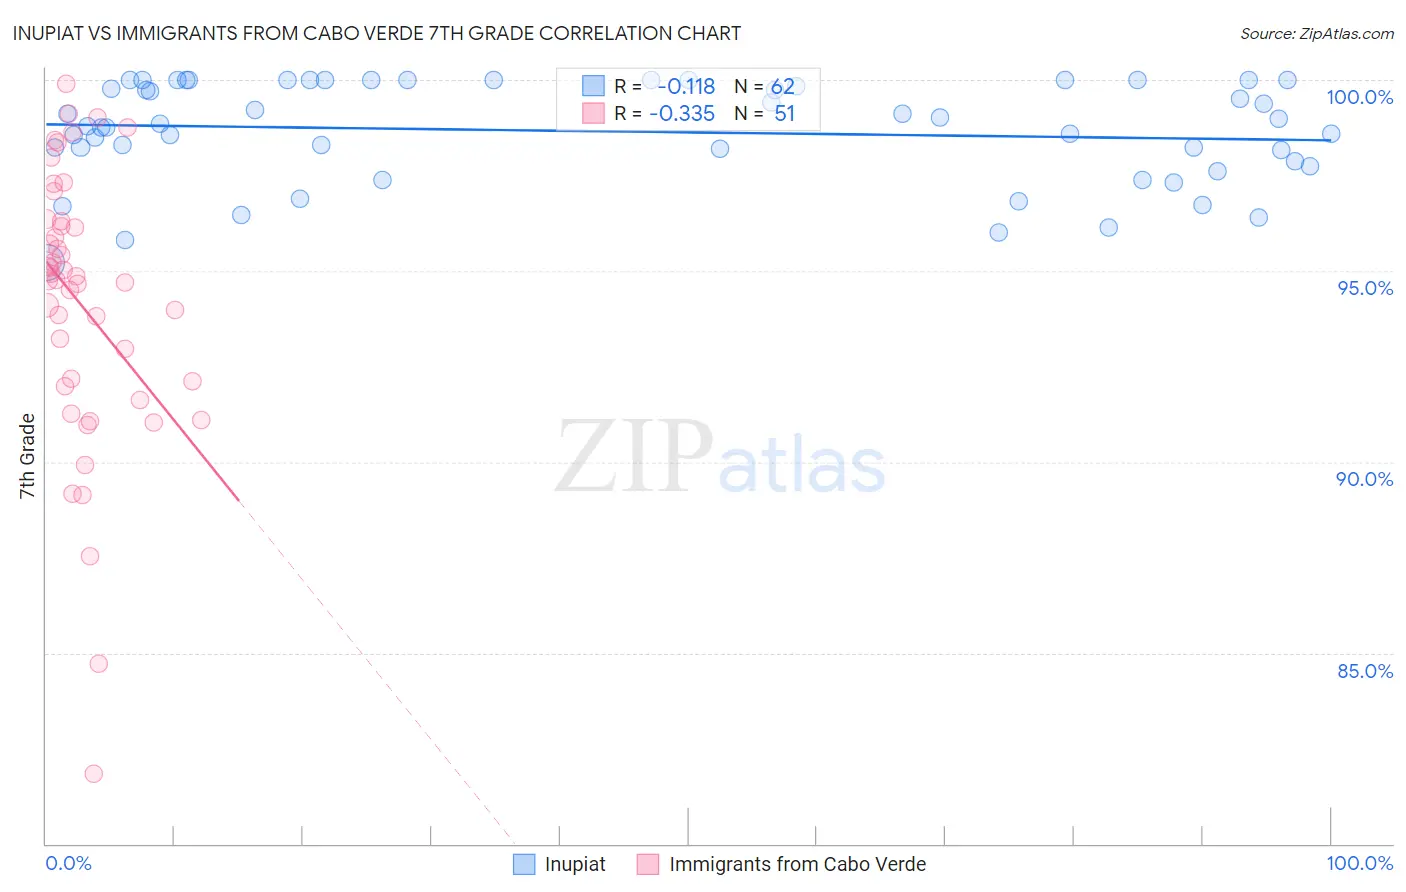
Inupiat vs Immigrants from Cabo Verde 7th Grade Correlation Chart
The statistical analysis conducted on geographies consisting of 96,348,974 people shows a poor negative correlation between the proportion of Inupiat and percentage of population with at least 7th grade education in the United States with a correlation coefficient (R) of -0.118 and weighted average of 97.4%. Similarly, the statistical analysis conducted on geographies consisting of 38,158,316 people shows a mild negative correlation between the proportion of Immigrants from Cabo Verde and percentage of population with at least 7th grade education in the United States with a correlation coefficient (R) of -0.335 and weighted average of 93.1%, a difference of 4.6%.
7th Grade Correlation Summary
| Measurement | Inupiat | Immigrants from Cabo Verde |
| Minimum | 95.2% | 81.8% |
| Maximum | 100.0% | 99.9% |
| Range | 4.8% | 18.1% |
| Mean | 98.7% | 94.1% |
| Median | 98.8% | 94.8% |
| Interquartile 25% (IQ1) | 97.9% | 92.0% |
| Interquartile 75% (IQ3) | 100.0% | 96.3% |
| Interquartile Range (IQR) | 2.1% | 4.3% |
| Standard Deviation (Sample) | 1.3% | 3.6% |
| Standard Deviation (Population) | 1.3% | 3.6% |
Similar Demographics by 7th Grade
Demographics Similar to Inupiat by 7th Grade
In terms of 7th grade, the demographic groups most similar to Inupiat are French Canadian (97.4%, a difference of 0.0%), Yup'ik (97.4%, a difference of 0.010%), Croatian (97.4%, a difference of 0.020%), Welsh (97.4%, a difference of 0.030%), and French (97.4%, a difference of 0.040%).
| Demographics | Rating | Rank | 7th Grade |
| Pennsylvania Germans | 100.0 /100 | #14 | Exceptional 97.6% |
| English | 100.0 /100 | #15 | Exceptional 97.6% |
| Irish | 100.0 /100 | #16 | Exceptional 97.5% |
| Scottish | 100.0 /100 | #17 | Exceptional 97.5% |
| Tlingit-Haida | 100.0 /100 | #18 | Exceptional 97.5% |
| Lithuanians | 100.0 /100 | #19 | Exceptional 97.5% |
| Yup'ik | 100.0 /100 | #20 | Exceptional 97.4% |
| Inupiat | 100.0 /100 | #21 | Exceptional 97.4% |
| French Canadians | 100.0 /100 | #22 | Exceptional 97.4% |
| Croatians | 100.0 /100 | #23 | Exceptional 97.4% |
| Welsh | 100.0 /100 | #24 | Exceptional 97.4% |
| French | 100.0 /100 | #25 | Exceptional 97.4% |
| Scotch-Irish | 100.0 /100 | #26 | Exceptional 97.4% |
| Danes | 100.0 /100 | #27 | Exceptional 97.4% |
| Sioux | 100.0 /100 | #28 | Exceptional 97.4% |
Demographics Similar to Immigrants from Cabo Verde by 7th Grade
In terms of 7th grade, the demographic groups most similar to Immigrants from Cabo Verde are Nepalese (93.2%, a difference of 0.070%), Immigrants from Nicaragua (93.0%, a difference of 0.13%), Immigrants from the Azores (93.0%, a difference of 0.17%), Central American Indian (93.3%, a difference of 0.18%), and Immigrants from Dominican Republic (92.9%, a difference of 0.22%).
| Demographics | Rating | Rank | 7th Grade |
| Immigrants | Fiji | 0.0 /100 | #320 | Tragic 93.5% |
| Belizeans | 0.0 /100 | #321 | Tragic 93.5% |
| Nicaraguans | 0.0 /100 | #322 | Tragic 93.5% |
| Immigrants | Belize | 0.0 /100 | #323 | Tragic 93.4% |
| Dominicans | 0.0 /100 | #324 | Tragic 93.3% |
| Central American Indians | 0.0 /100 | #325 | Tragic 93.3% |
| Nepalese | 0.0 /100 | #326 | Tragic 93.2% |
| Immigrants | Cabo Verde | 0.0 /100 | #327 | Tragic 93.1% |
| Immigrants | Nicaragua | 0.0 /100 | #328 | Tragic 93.0% |
| Immigrants | Azores | 0.0 /100 | #329 | Tragic 93.0% |
| Immigrants | Dominican Republic | 0.0 /100 | #330 | Tragic 92.9% |
| Hondurans | 0.0 /100 | #331 | Tragic 92.9% |
| Hispanics or Latinos | 0.0 /100 | #332 | Tragic 92.7% |
| Immigrants | Armenia | 0.0 /100 | #333 | Tragic 92.7% |
| Immigrants | Yemen | 0.0 /100 | #334 | Tragic 92.6% |