Inupiat vs Immigrants from Saudi Arabia Bachelor's Degree
COMPARE
Inupiat
Immigrants from Saudi Arabia
Bachelor's Degree
Bachelor's Degree Comparison
Inupiat
Immigrants from Saudi Arabia
25.8%
BACHELOR'S DEGREE
0.0/ 100
METRIC RATING
337th/ 347
METRIC RANK
44.8%
BACHELOR'S DEGREE
100.0/ 100
METRIC RATING
42nd/ 347
METRIC RANK
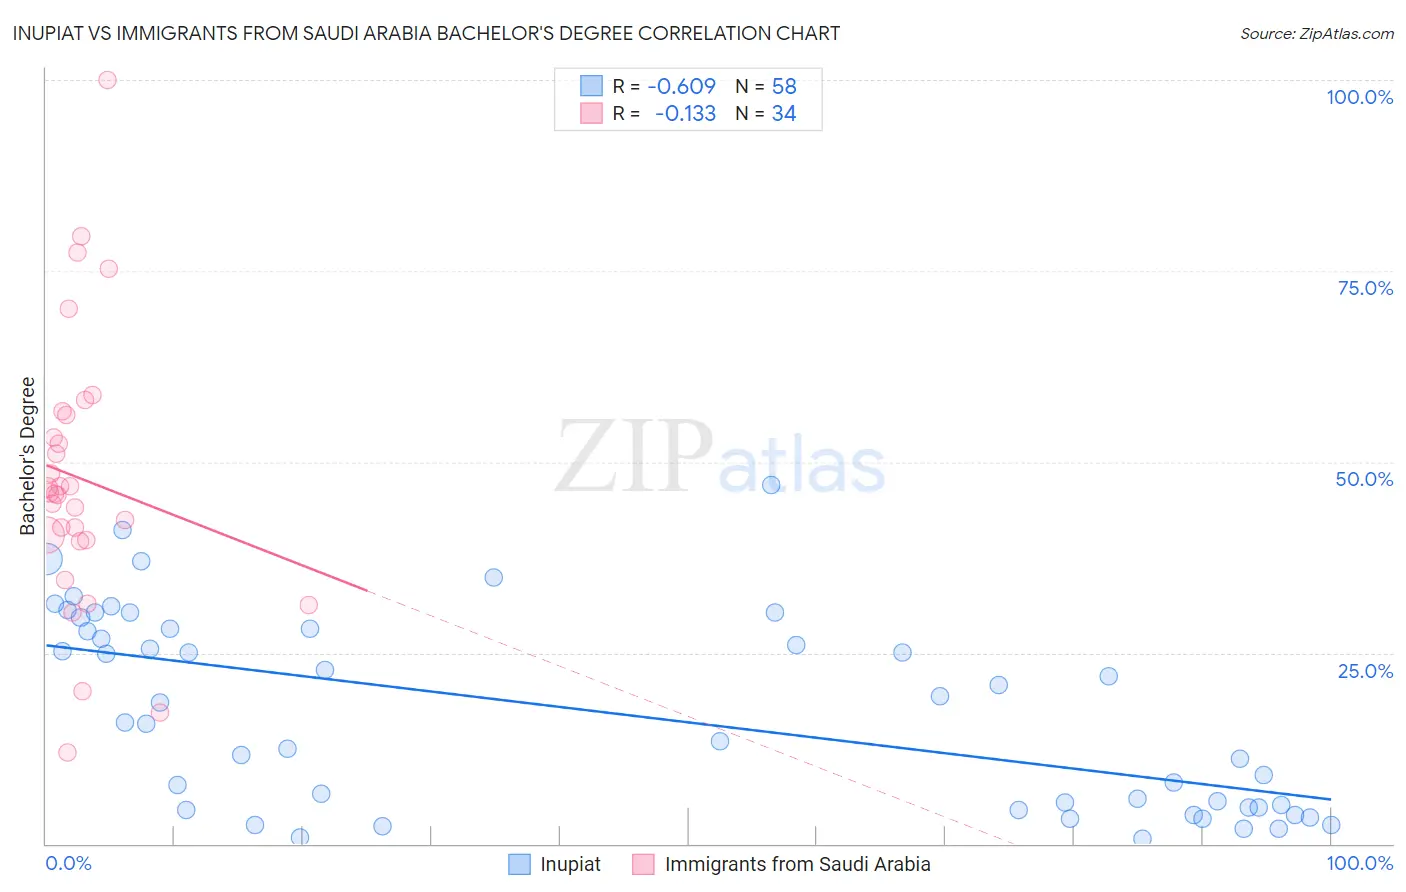
Inupiat vs Immigrants from Saudi Arabia Bachelor's Degree Correlation Chart
The statistical analysis conducted on geographies consisting of 96,347,168 people shows a significant negative correlation between the proportion of Inupiat and percentage of population with at least bachelor's degree education in the United States with a correlation coefficient (R) of -0.609 and weighted average of 25.8%. Similarly, the statistical analysis conducted on geographies consisting of 164,289,450 people shows a poor negative correlation between the proportion of Immigrants from Saudi Arabia and percentage of population with at least bachelor's degree education in the United States with a correlation coefficient (R) of -0.133 and weighted average of 44.8%, a difference of 73.7%.
Bachelor's Degree Correlation Summary
| Measurement | Inupiat | Immigrants from Saudi Arabia |
| Minimum | 0.66% | 11.9% |
| Maximum | 47.0% | 100.0% |
| Range | 46.4% | 88.1% |
| Mean | 17.1% | 47.8% |
| Median | 15.8% | 45.9% |
| Interquartile 25% (IQ1) | 4.7% | 39.7% |
| Interquartile 75% (IQ3) | 28.1% | 56.1% |
| Interquartile Range (IQR) | 23.4% | 16.4% |
| Standard Deviation (Sample) | 12.7% | 18.0% |
| Standard Deviation (Population) | 12.6% | 17.7% |
Similar Demographics by Bachelor's Degree
Demographics Similar to Inupiat by Bachelor's Degree
In terms of bachelor's degree, the demographic groups most similar to Inupiat are Pueblo (25.5%, a difference of 1.1%), Immigrants from Mexico (26.1%, a difference of 1.3%), Native/Alaskan (26.3%, a difference of 2.0%), Hopi (25.3%, a difference of 2.0%), and Arapaho (26.6%, a difference of 3.2%).
| Demographics | Rating | Rank | Bachelor's Degree |
| Spanish American Indians | 0.0 /100 | #330 | Tragic 27.5% |
| Immigrants | Azores | 0.0 /100 | #331 | Tragic 27.3% |
| Menominee | 0.0 /100 | #332 | Tragic 27.3% |
| Mexicans | 0.0 /100 | #333 | Tragic 27.1% |
| Arapaho | 0.0 /100 | #334 | Tragic 26.6% |
| Natives/Alaskans | 0.0 /100 | #335 | Tragic 26.3% |
| Immigrants | Mexico | 0.0 /100 | #336 | Tragic 26.1% |
| Inupiat | 0.0 /100 | #337 | Tragic 25.8% |
| Pueblo | 0.0 /100 | #338 | Tragic 25.5% |
| Hopi | 0.0 /100 | #339 | Tragic 25.3% |
| Lumbee | 0.0 /100 | #340 | Tragic 24.8% |
| Yuman | 0.0 /100 | #341 | Tragic 24.5% |
| Yakama | 0.0 /100 | #342 | Tragic 24.5% |
| Tohono O'odham | 0.0 /100 | #343 | Tragic 24.4% |
| Navajo | 0.0 /100 | #344 | Tragic 23.6% |
Demographics Similar to Immigrants from Saudi Arabia by Bachelor's Degree
In terms of bachelor's degree, the demographic groups most similar to Immigrants from Saudi Arabia are Immigrants from South Africa (44.8%, a difference of 0.14%), Immigrants from Malaysia (45.0%, a difference of 0.38%), Immigrants from Belarus (45.0%, a difference of 0.42%), Immigrants from Lithuania (44.6%, a difference of 0.49%), and Immigrants from Kuwait (44.6%, a difference of 0.52%).
| Demographics | Rating | Rank | Bachelor's Degree |
| Immigrants | Russia | 100.0 /100 | #35 | Exceptional 45.4% |
| Mongolians | 100.0 /100 | #36 | Exceptional 45.4% |
| Russians | 100.0 /100 | #37 | Exceptional 45.3% |
| Bulgarians | 100.0 /100 | #38 | Exceptional 45.3% |
| Immigrants | Latvia | 100.0 /100 | #39 | Exceptional 45.1% |
| Immigrants | Belarus | 100.0 /100 | #40 | Exceptional 45.0% |
| Immigrants | Malaysia | 100.0 /100 | #41 | Exceptional 45.0% |
| Immigrants | Saudi Arabia | 100.0 /100 | #42 | Exceptional 44.8% |
| Immigrants | South Africa | 99.9 /100 | #43 | Exceptional 44.8% |
| Immigrants | Lithuania | 99.9 /100 | #44 | Exceptional 44.6% |
| Immigrants | Kuwait | 99.9 /100 | #45 | Exceptional 44.6% |
| Immigrants | Bulgaria | 99.9 /100 | #46 | Exceptional 44.6% |
| Bolivians | 99.9 /100 | #47 | Exceptional 44.6% |
| Estonians | 99.9 /100 | #48 | Exceptional 44.6% |
| Immigrants | Norway | 99.9 /100 | #49 | Exceptional 44.5% |