Indonesian vs Immigrants from Belarus College, Under 1 year
COMPARE
Indonesian
Immigrants from Belarus
College, Under 1 year
College, Under 1 year Comparison
Indonesians
Immigrants from Belarus
61.2%
COLLEGE, UNDER 1 YEAR
0.3/ 100
METRIC RATING
259th/ 347
METRIC RANK
69.2%
COLLEGE, UNDER 1 YEAR
99.5/ 100
METRIC RATING
62nd/ 347
METRIC RANK
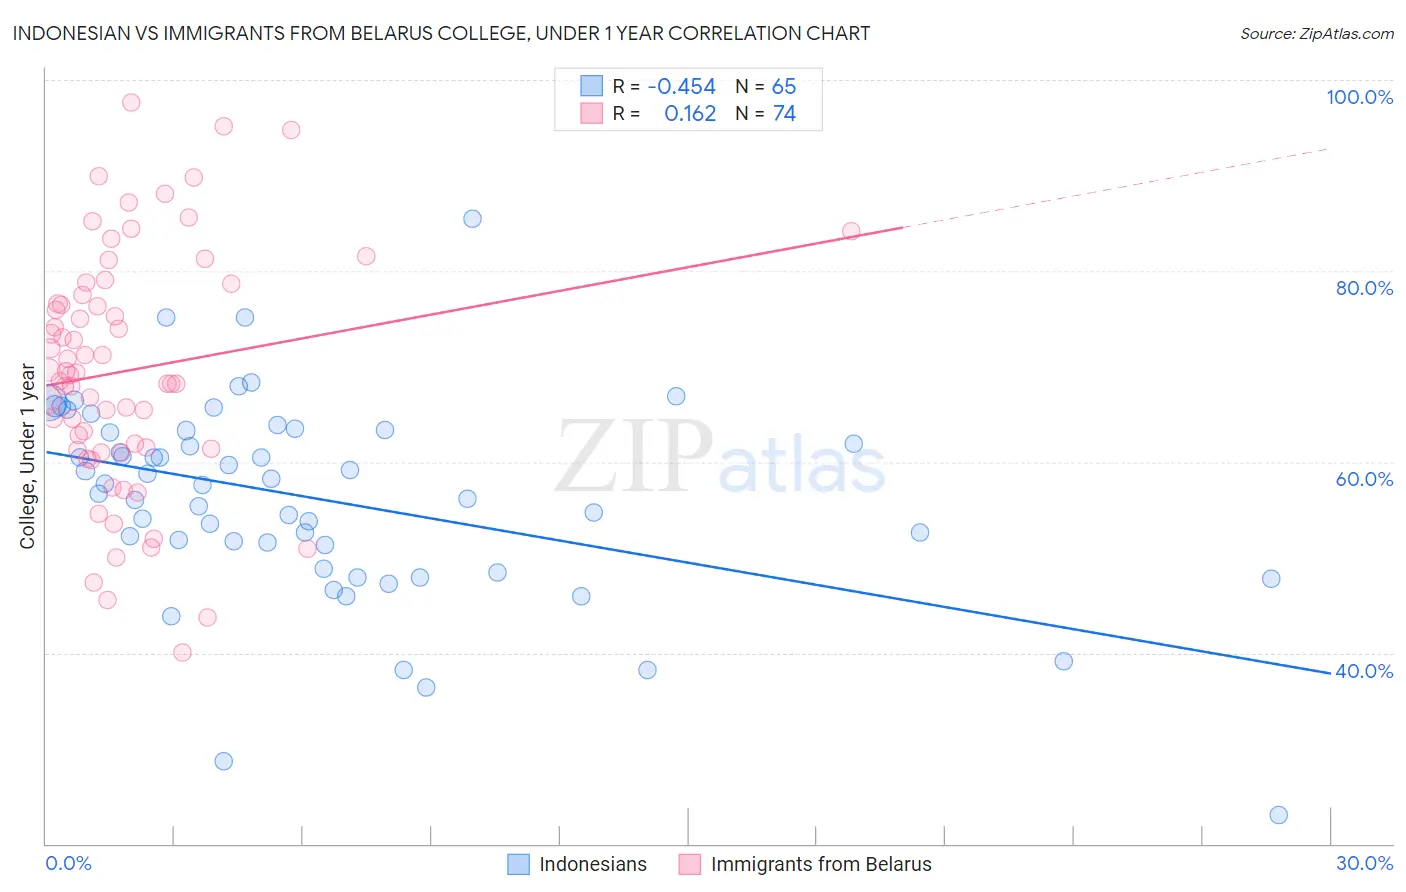
Indonesian vs Immigrants from Belarus College, Under 1 year Correlation Chart
The statistical analysis conducted on geographies consisting of 162,726,213 people shows a moderate negative correlation between the proportion of Indonesians and percentage of population with at least college, under 1 year education in the United States with a correlation coefficient (R) of -0.454 and weighted average of 61.2%. Similarly, the statistical analysis conducted on geographies consisting of 150,205,158 people shows a poor positive correlation between the proportion of Immigrants from Belarus and percentage of population with at least college, under 1 year education in the United States with a correlation coefficient (R) of 0.162 and weighted average of 69.2%, a difference of 12.9%.
College, Under 1 year Correlation Summary
| Measurement | Indonesian | Immigrants from Belarus |
| Minimum | 23.1% | 40.0% |
| Maximum | 85.5% | 97.7% |
| Range | 62.4% | 57.6% |
| Mean | 56.1% | 69.6% |
| Median | 57.6% | 69.2% |
| Interquartile 25% (IQ1) | 50.0% | 61.3% |
| Interquartile 75% (IQ3) | 63.3% | 77.5% |
| Interquartile Range (IQR) | 13.3% | 16.2% |
| Standard Deviation (Sample) | 10.7% | 12.6% |
| Standard Deviation (Population) | 10.6% | 12.5% |
Similar Demographics by College, Under 1 year
Demographics Similar to Indonesians by College, Under 1 year
In terms of college, under 1 year, the demographic groups most similar to Indonesians are Immigrants from Bangladesh (61.3%, a difference of 0.020%), Immigrants from Laos (61.3%, a difference of 0.080%), Blackfeet (61.1%, a difference of 0.17%), Bangladeshi (61.4%, a difference of 0.20%), and African (61.1%, a difference of 0.20%).
| Demographics | Rating | Rank | College, Under 1 year |
| West Indians | 0.4 /100 | #252 | Tragic 61.5% |
| Japanese | 0.4 /100 | #253 | Tragic 61.5% |
| Immigrants | Cambodia | 0.4 /100 | #254 | Tragic 61.5% |
| Comanche | 0.4 /100 | #255 | Tragic 61.4% |
| Bangladeshis | 0.4 /100 | #256 | Tragic 61.4% |
| Immigrants | Laos | 0.3 /100 | #257 | Tragic 61.3% |
| Immigrants | Bangladesh | 0.3 /100 | #258 | Tragic 61.3% |
| Indonesians | 0.3 /100 | #259 | Tragic 61.2% |
| Blackfeet | 0.3 /100 | #260 | Tragic 61.1% |
| Africans | 0.3 /100 | #261 | Tragic 61.1% |
| Barbadians | 0.2 /100 | #262 | Tragic 61.1% |
| Shoshone | 0.2 /100 | #263 | Tragic 61.1% |
| Trinidadians and Tobagonians | 0.2 /100 | #264 | Tragic 61.1% |
| Immigrants | Bahamas | 0.2 /100 | #265 | Tragic 61.1% |
| Alaskan Athabascans | 0.2 /100 | #266 | Tragic 61.0% |
Demographics Similar to Immigrants from Belarus by College, Under 1 year
In terms of college, under 1 year, the demographic groups most similar to Immigrants from Belarus are Immigrants from Kazakhstan (69.2%, a difference of 0.0%), Immigrants from Asia (69.2%, a difference of 0.040%), Immigrants from Serbia (69.3%, a difference of 0.13%), Immigrants from Canada (69.1%, a difference of 0.13%), and Northern European (69.0%, a difference of 0.17%).
| Demographics | Rating | Rank | College, Under 1 year |
| Maltese | 99.7 /100 | #55 | Exceptional 69.5% |
| Immigrants | Scotland | 99.6 /100 | #56 | Exceptional 69.4% |
| Asians | 99.6 /100 | #57 | Exceptional 69.4% |
| Immigrants | Malaysia | 99.6 /100 | #58 | Exceptional 69.3% |
| Immigrants | Serbia | 99.5 /100 | #59 | Exceptional 69.3% |
| Immigrants | Asia | 99.5 /100 | #60 | Exceptional 69.2% |
| Immigrants | Kazakhstan | 99.5 /100 | #61 | Exceptional 69.2% |
| Immigrants | Belarus | 99.5 /100 | #62 | Exceptional 69.2% |
| Immigrants | Canada | 99.4 /100 | #63 | Exceptional 69.1% |
| Northern Europeans | 99.4 /100 | #64 | Exceptional 69.0% |
| Immigrants | Moldova | 99.3 /100 | #65 | Exceptional 69.0% |
| Immigrants | North America | 99.3 /100 | #66 | Exceptional 69.0% |
| Immigrants | Zimbabwe | 99.2 /100 | #67 | Exceptional 68.9% |
| Immigrants | Indonesia | 99.2 /100 | #68 | Exceptional 68.9% |
| Immigrants | Romania | 99.2 /100 | #69 | Exceptional 68.9% |