Immigrants from Colombia vs Ukrainian 11th Grade
COMPARE
Immigrants from Colombia
Ukrainian
11th Grade
11th Grade Comparison
Immigrants from Colombia
Ukrainians
91.4%
11TH GRADE
0.6/ 100
METRIC RATING
258th/ 347
METRIC RANK
94.0%
11TH GRADE
99.8/ 100
METRIC RATING
63rd/ 347
METRIC RANK
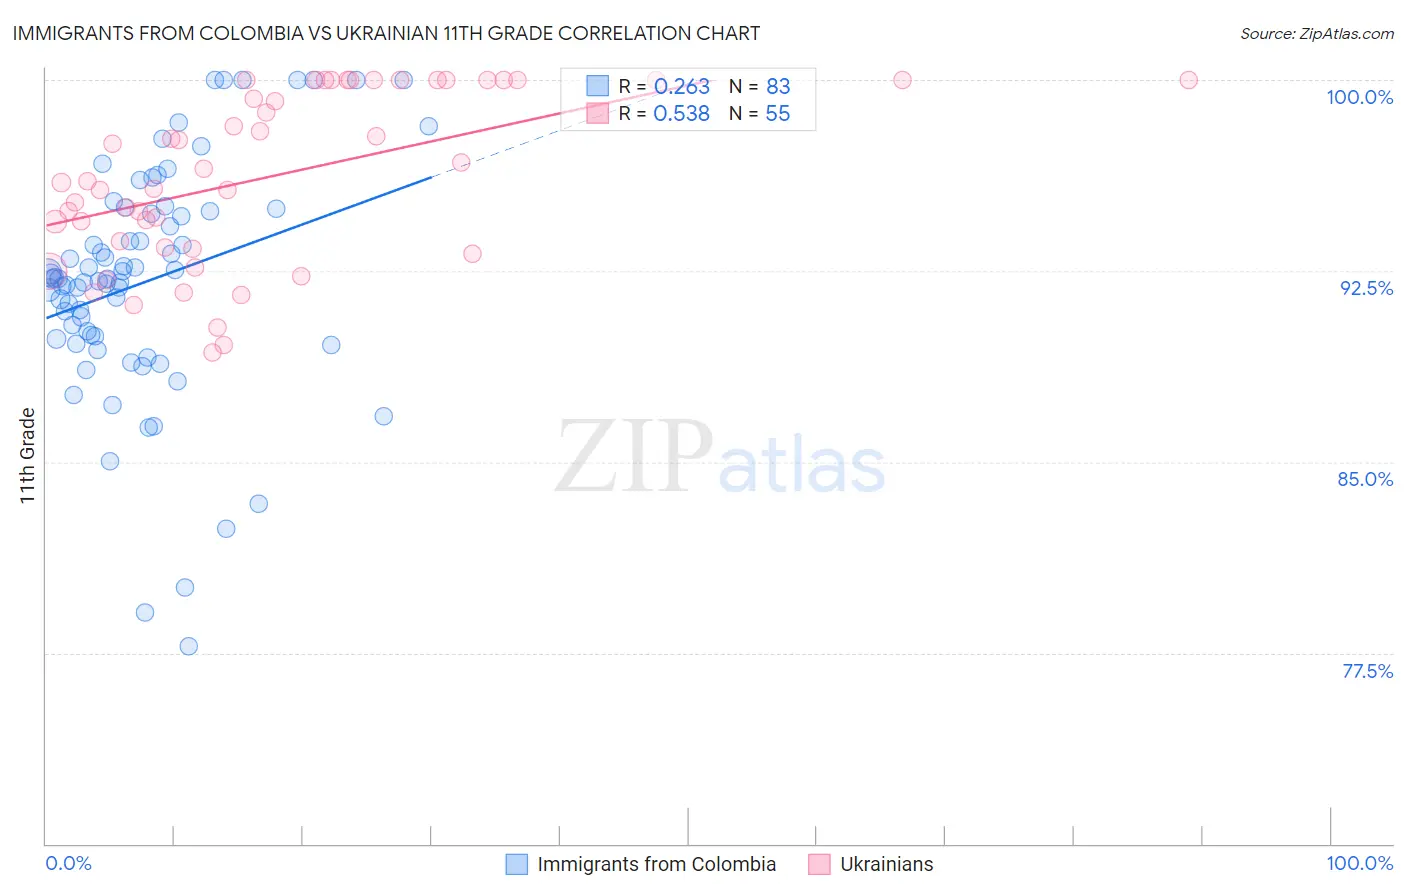
Immigrants from Colombia vs Ukrainian 11th Grade Correlation Chart
The statistical analysis conducted on geographies consisting of 378,643,826 people shows a weak positive correlation between the proportion of Immigrants from Colombia and percentage of population with at least 11th grade education in the United States with a correlation coefficient (R) of 0.263 and weighted average of 91.4%. Similarly, the statistical analysis conducted on geographies consisting of 448,696,775 people shows a substantial positive correlation between the proportion of Ukrainians and percentage of population with at least 11th grade education in the United States with a correlation coefficient (R) of 0.538 and weighted average of 94.0%, a difference of 2.8%.
11th Grade Correlation Summary
| Measurement | Immigrants from Colombia | Ukrainian |
| Minimum | 77.8% | 89.3% |
| Maximum | 100.0% | 100.0% |
| Range | 22.2% | 10.7% |
| Mean | 92.1% | 96.2% |
| Median | 92.2% | 96.0% |
| Interquartile 25% (IQ1) | 89.8% | 93.4% |
| Interquartile 75% (IQ3) | 94.8% | 100.0% |
| Interquartile Range (IQR) | 5.0% | 6.6% |
| Standard Deviation (Sample) | 4.6% | 3.3% |
| Standard Deviation (Population) | 4.6% | 3.3% |
Similar Demographics by 11th Grade
Demographics Similar to Immigrants from Colombia by 11th Grade
In terms of 11th grade, the demographic groups most similar to Immigrants from Colombia are Jamaican (91.4%, a difference of 0.010%), Cajun (91.4%, a difference of 0.020%), Spanish American (91.4%, a difference of 0.020%), Black/African American (91.4%, a difference of 0.030%), and Immigrants from Senegal (91.4%, a difference of 0.030%).
| Demographics | Rating | Rank | 11th Grade |
| Immigrants | Costa Rica | 0.9 /100 | #251 | Tragic 91.4% |
| Immigrants | Nigeria | 0.8 /100 | #252 | Tragic 91.4% |
| Immigrants | South America | 0.8 /100 | #253 | Tragic 91.4% |
| Immigrants | Eritrea | 0.7 /100 | #254 | Tragic 91.4% |
| Blacks/African Americans | 0.7 /100 | #255 | Tragic 91.4% |
| Immigrants | Senegal | 0.7 /100 | #256 | Tragic 91.4% |
| Cajuns | 0.7 /100 | #257 | Tragic 91.4% |
| Immigrants | Colombia | 0.6 /100 | #258 | Tragic 91.4% |
| Jamaicans | 0.6 /100 | #259 | Tragic 91.4% |
| Spanish Americans | 0.6 /100 | #260 | Tragic 91.4% |
| Taiwanese | 0.6 /100 | #261 | Tragic 91.3% |
| Immigrants | Uruguay | 0.5 /100 | #262 | Tragic 91.3% |
| Immigrants | Ghana | 0.3 /100 | #263 | Tragic 91.2% |
| Yup'ik | 0.3 /100 | #264 | Tragic 91.2% |
| Pueblo | 0.3 /100 | #265 | Tragic 91.2% |
Demographics Similar to Ukrainians by 11th Grade
In terms of 11th grade, the demographic groups most similar to Ukrainians are Austrian (94.0%, a difference of 0.020%), Bhutanese (94.0%, a difference of 0.030%), Okinawan (94.0%, a difference of 0.030%), Immigrants from Belgium (94.0%, a difference of 0.030%), and Immigrants from Sweden (93.9%, a difference of 0.030%).
| Demographics | Rating | Rank | 11th Grade |
| French Canadians | 99.9 /100 | #56 | Exceptional 94.0% |
| New Zealanders | 99.9 /100 | #57 | Exceptional 94.0% |
| Iranians | 99.9 /100 | #58 | Exceptional 94.0% |
| Bhutanese | 99.8 /100 | #59 | Exceptional 94.0% |
| Okinawans | 99.8 /100 | #60 | Exceptional 94.0% |
| Immigrants | Belgium | 99.8 /100 | #61 | Exceptional 94.0% |
| Austrians | 99.8 /100 | #62 | Exceptional 94.0% |
| Ukrainians | 99.8 /100 | #63 | Exceptional 94.0% |
| Immigrants | Sweden | 99.8 /100 | #64 | Exceptional 93.9% |
| Native Hawaiians | 99.8 /100 | #65 | Exceptional 93.9% |
| Alaskan Athabascans | 99.8 /100 | #66 | Exceptional 93.9% |
| Immigrants | Netherlands | 99.8 /100 | #67 | Exceptional 93.9% |
| Zimbabweans | 99.8 /100 | #68 | Exceptional 93.9% |
| Scotch-Irish | 99.8 /100 | #69 | Exceptional 93.9% |
| Immigrants | England | 99.7 /100 | #70 | Exceptional 93.8% |