Immigrants vs Ukrainian Female Disability
COMPARE
Immigrants
Ukrainian
Female Disability
Female Disability Comparison
Immigrants
Ukrainians
11.7%
FEMALE DISABILITY
98.1/ 100
METRIC RATING
109th/ 347
METRIC RANK
12.3%
FEMALE DISABILITY
27.2/ 100
METRIC RATING
194th/ 347
METRIC RANK
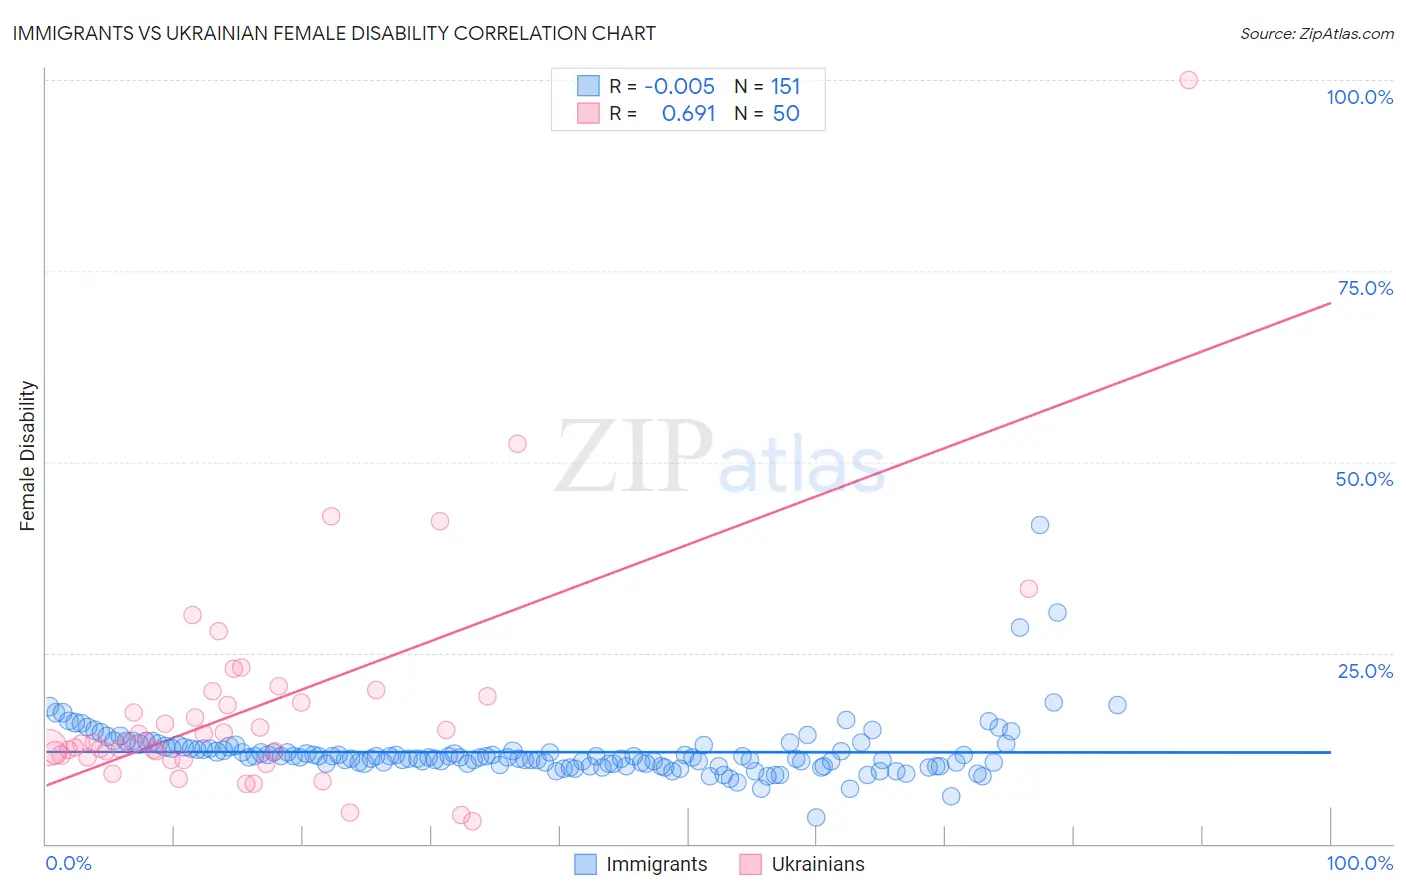
Immigrants vs Ukrainian Female Disability Correlation Chart
The statistical analysis conducted on geographies consisting of 577,392,007 people shows no correlation between the proportion of Immigrants and percentage of females with a disability in the United States with a correlation coefficient (R) of -0.005 and weighted average of 11.7%. Similarly, the statistical analysis conducted on geographies consisting of 448,602,757 people shows a significant positive correlation between the proportion of Ukrainians and percentage of females with a disability in the United States with a correlation coefficient (R) of 0.691 and weighted average of 12.3%, a difference of 4.8%.
Female Disability Correlation Summary
| Measurement | Immigrants | Ukrainian |
| Minimum | 3.5% | 2.9% |
| Maximum | 41.7% | 100.0% |
| Range | 38.2% | 97.1% |
| Mean | 12.0% | 18.0% |
| Median | 11.4% | 13.3% |
| Interquartile 25% (IQ1) | 10.4% | 11.6% |
| Interquartile 75% (IQ3) | 12.7% | 19.4% |
| Interquartile Range (IQR) | 2.2% | 7.7% |
| Standard Deviation (Sample) | 3.9% | 15.3% |
| Standard Deviation (Population) | 3.8% | 15.1% |
Similar Demographics by Female Disability
Demographics Similar to Immigrants by Female Disability
In terms of female disability, the demographic groups most similar to Immigrants are Soviet Union (11.7%, a difference of 0.0%), Costa Rican (11.7%, a difference of 0.020%), New Zealander (11.7%, a difference of 0.030%), Latvian (11.7%, a difference of 0.050%), and Immigrants from Greece (11.7%, a difference of 0.080%).
| Demographics | Rating | Rank | Female Disability |
| Immigrants | South Eastern Asia | 98.4 /100 | #102 | Exceptional 11.7% |
| Immigrants | Eastern Africa | 98.3 /100 | #103 | Exceptional 11.7% |
| Immigrants | Western Asia | 98.3 /100 | #104 | Exceptional 11.7% |
| Australians | 98.3 /100 | #105 | Exceptional 11.7% |
| Immigrants | Greece | 98.2 /100 | #106 | Exceptional 11.7% |
| Latvians | 98.2 /100 | #107 | Exceptional 11.7% |
| New Zealanders | 98.1 /100 | #108 | Exceptional 11.7% |
| Immigrants | Immigrants | 98.1 /100 | #109 | Exceptional 11.7% |
| Soviet Union | 98.1 /100 | #110 | Exceptional 11.7% |
| Costa Ricans | 98.1 /100 | #111 | Exceptional 11.7% |
| Immigrants | Bangladesh | 97.8 /100 | #112 | Exceptional 11.8% |
| Immigrants | Belarus | 97.8 /100 | #113 | Exceptional 11.8% |
| South Africans | 97.7 /100 | #114 | Exceptional 11.8% |
| Brazilians | 97.7 /100 | #115 | Exceptional 11.8% |
| Immigrants | Morocco | 97.6 /100 | #116 | Exceptional 11.8% |
Demographics Similar to Ukrainians by Female Disability
In terms of female disability, the demographic groups most similar to Ukrainians are Northern European (12.3%, a difference of 0.010%), Swedish (12.3%, a difference of 0.030%), Immigrants from Panama (12.3%, a difference of 0.080%), Honduran (12.3%, a difference of 0.080%), and Immigrants from Western Africa (12.3%, a difference of 0.090%).
| Demographics | Rating | Rank | Female Disability |
| Serbians | 33.1 /100 | #187 | Fair 12.3% |
| Immigrants | North America | 32.8 /100 | #188 | Fair 12.3% |
| Immigrants | Albania | 31.6 /100 | #189 | Fair 12.3% |
| Immigrants | Honduras | 31.3 /100 | #190 | Fair 12.3% |
| Armenians | 29.7 /100 | #191 | Fair 12.3% |
| Immigrants | Western Africa | 29.2 /100 | #192 | Fair 12.3% |
| Northern Europeans | 27.5 /100 | #193 | Fair 12.3% |
| Ukrainians | 27.2 /100 | #194 | Fair 12.3% |
| Swedes | 26.6 /100 | #195 | Fair 12.3% |
| Immigrants | Panama | 25.5 /100 | #196 | Fair 12.3% |
| Hondurans | 25.4 /100 | #197 | Fair 12.3% |
| Mexican American Indians | 24.9 /100 | #198 | Fair 12.3% |
| Immigrants | Trinidad and Tobago | 24.7 /100 | #199 | Fair 12.3% |
| Trinidadians and Tobagonians | 22.4 /100 | #200 | Fair 12.3% |
| Chinese | 22.1 /100 | #201 | Fair 12.3% |