Immigrants from Western Africa vs Immigrants from Chile Female Poverty Among 18-24 Year Olds
COMPARE
Immigrants from Western Africa
Immigrants from Chile
Female Poverty Among 18-24 Year Olds
Female Poverty Among 18-24 Year Olds Comparison
Immigrants from Western Africa
Immigrants from Chile
20.6%
FEMALE POVERTY AMONG 18-24 YEAR OLDS
10.2/ 100
METRIC RATING
216th/ 347
METRIC RANK
19.4%
FEMALE POVERTY AMONG 18-24 YEAR OLDS
94.3/ 100
METRIC RATING
124th/ 347
METRIC RANK
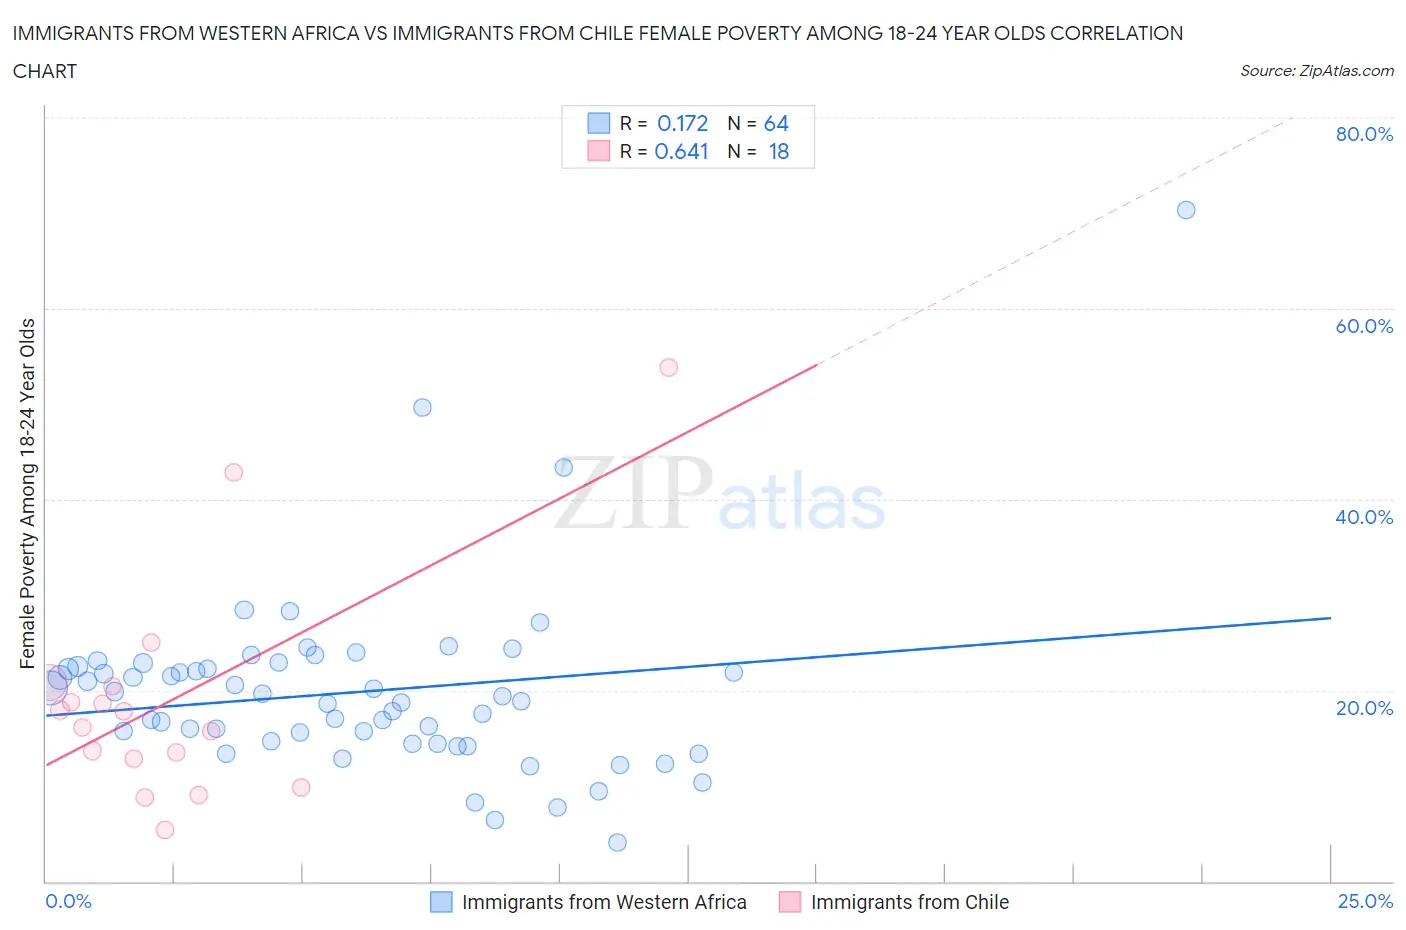
Immigrants from Western Africa vs Immigrants from Chile Female Poverty Among 18-24 Year Olds Correlation Chart
The statistical analysis conducted on geographies consisting of 351,136,823 people shows a poor positive correlation between the proportion of Immigrants from Western Africa and poverty level among females between the ages 18 and 24 in the United States with a correlation coefficient (R) of 0.172 and weighted average of 20.6%. Similarly, the statistical analysis conducted on geographies consisting of 216,013,605 people shows a significant positive correlation between the proportion of Immigrants from Chile and poverty level among females between the ages 18 and 24 in the United States with a correlation coefficient (R) of 0.641 and weighted average of 19.4%, a difference of 6.3%.
Female Poverty Among 18-24 Year Olds Correlation Summary
| Measurement | Immigrants from Western Africa | Immigrants from Chile |
| Minimum | 4.0% | 5.3% |
| Maximum | 70.3% | 53.8% |
| Range | 66.3% | 48.5% |
| Mean | 19.8% | 18.9% |
| Median | 19.1% | 16.9% |
| Interquartile 25% (IQ1) | 14.6% | 12.8% |
| Interquartile 75% (IQ3) | 22.4% | 20.4% |
| Interquartile Range (IQR) | 7.8% | 7.7% |
| Standard Deviation (Sample) | 9.7% | 11.9% |
| Standard Deviation (Population) | 9.6% | 11.6% |
Similar Demographics by Female Poverty Among 18-24 Year Olds
Demographics Similar to Immigrants from Western Africa by Female Poverty Among 18-24 Year Olds
In terms of female poverty among 18-24 year olds, the demographic groups most similar to Immigrants from Western Africa are Spanish (20.6%, a difference of 0.020%), Immigrants from South Africa (20.6%, a difference of 0.050%), Immigrants from Laos (20.6%, a difference of 0.070%), Immigrants from Nepal (20.7%, a difference of 0.080%), and Immigrants from Micronesia (20.7%, a difference of 0.090%).
| Demographics | Rating | Rank | Female Poverty Among 18-24 Year Olds |
| Arabs | 15.5 /100 | #209 | Poor 20.5% |
| Immigrants | Ghana | 14.3 /100 | #210 | Poor 20.5% |
| Immigrants | Western Europe | 13.5 /100 | #211 | Poor 20.6% |
| Liberians | 11.6 /100 | #212 | Poor 20.6% |
| Northern Europeans | 11.6 /100 | #213 | Poor 20.6% |
| Immigrants | South Africa | 10.7 /100 | #214 | Poor 20.6% |
| Spanish | 10.4 /100 | #215 | Poor 20.6% |
| Immigrants | Western Africa | 10.2 /100 | #216 | Poor 20.6% |
| Immigrants | Laos | 9.7 /100 | #217 | Tragic 20.6% |
| Immigrants | Nepal | 9.6 /100 | #218 | Tragic 20.7% |
| Immigrants | Micronesia | 9.6 /100 | #219 | Tragic 20.7% |
| British | 9.4 /100 | #220 | Tragic 20.7% |
| Barbadians | 9.0 /100 | #221 | Tragic 20.7% |
| Guatemalans | 8.1 /100 | #222 | Tragic 20.7% |
| French | 7.9 /100 | #223 | Tragic 20.7% |
Demographics Similar to Immigrants from Chile by Female Poverty Among 18-24 Year Olds
In terms of female poverty among 18-24 year olds, the demographic groups most similar to Immigrants from Chile are Immigrants from Panama (19.4%, a difference of 0.060%), Cambodian (19.4%, a difference of 0.070%), Paraguayan (19.4%, a difference of 0.070%), Immigrants from Russia (19.4%, a difference of 0.13%), and Cape Verdean (19.4%, a difference of 0.15%).
| Demographics | Rating | Rank | Female Poverty Among 18-24 Year Olds |
| Immigrants | Iran | 95.8 /100 | #117 | Exceptional 19.3% |
| Immigrants | Guyana | 95.6 /100 | #118 | Exceptional 19.3% |
| Cypriots | 95.5 /100 | #119 | Exceptional 19.3% |
| Immigrants | Northern Europe | 95.4 /100 | #120 | Exceptional 19.4% |
| Guyanese | 95.3 /100 | #121 | Exceptional 19.4% |
| Cambodians | 94.6 /100 | #122 | Exceptional 19.4% |
| Paraguayans | 94.6 /100 | #123 | Exceptional 19.4% |
| Immigrants | Chile | 94.3 /100 | #124 | Exceptional 19.4% |
| Immigrants | Panama | 94.0 /100 | #125 | Exceptional 19.4% |
| Immigrants | Russia | 93.7 /100 | #126 | Exceptional 19.4% |
| Cape Verdeans | 93.6 /100 | #127 | Exceptional 19.4% |
| Slovaks | 92.9 /100 | #128 | Exceptional 19.5% |
| Immigrants | England | 92.9 /100 | #129 | Exceptional 19.5% |
| Immigrants | Canada | 92.9 /100 | #130 | Exceptional 19.5% |
| Latvians | 92.7 /100 | #131 | Exceptional 19.5% |