Immigrants from Western Africa vs Inupiat College, Under 1 year
COMPARE
Immigrants from Western Africa
Inupiat
College, Under 1 year
College, Under 1 year Comparison
Immigrants from Western Africa
Inupiat
62.8%
COLLEGE, UNDER 1 YEAR
2.4/ 100
METRIC RATING
231st/ 347
METRIC RANK
54.6%
COLLEGE, UNDER 1 YEAR
0.0/ 100
METRIC RATING
335th/ 347
METRIC RANK
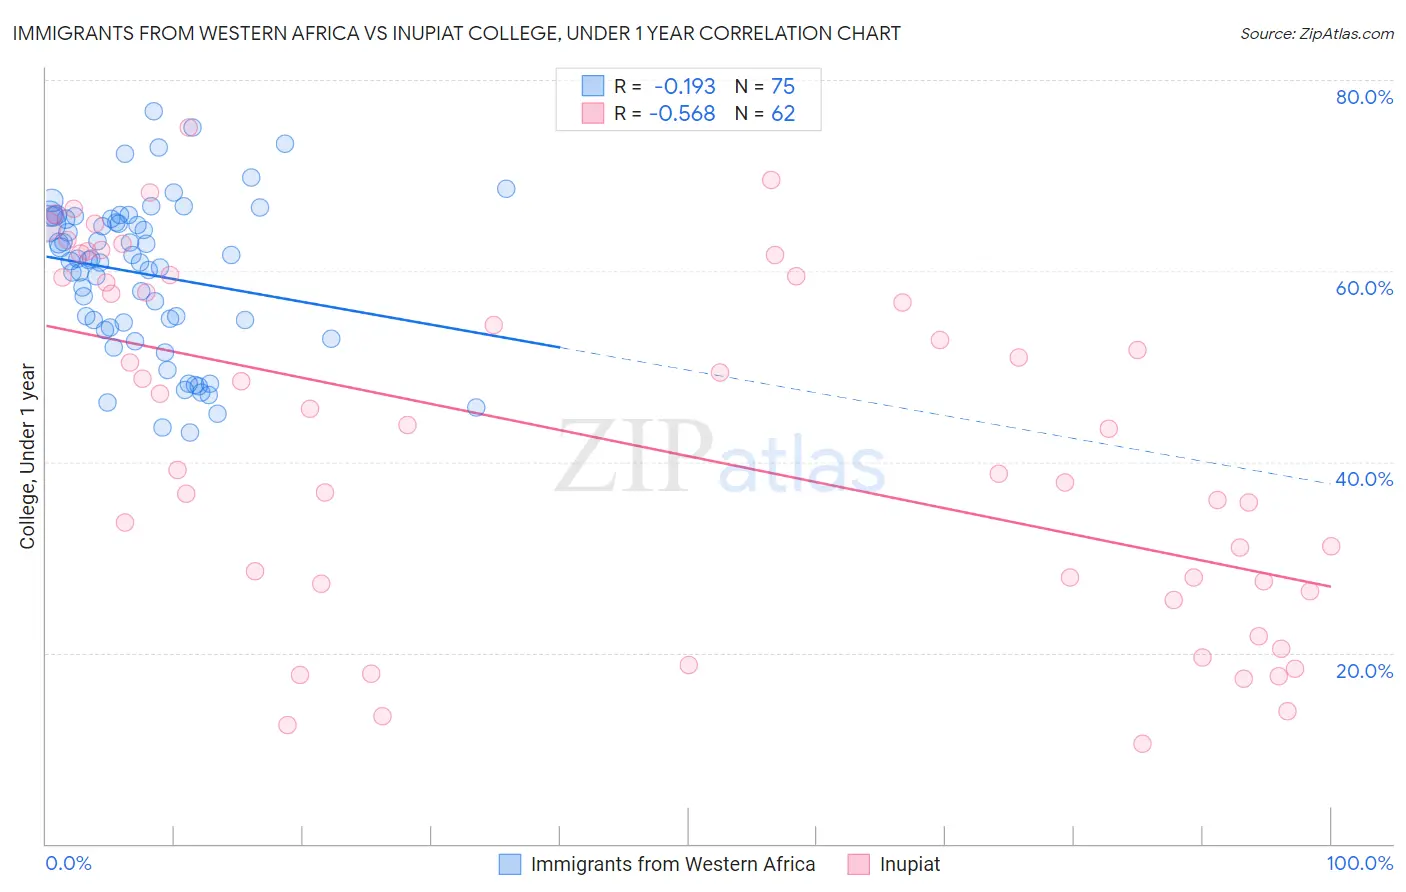
Immigrants from Western Africa vs Inupiat College, Under 1 year Correlation Chart
The statistical analysis conducted on geographies consisting of 357,885,062 people shows a poor negative correlation between the proportion of Immigrants from Western Africa and percentage of population with at least college, under 1 year education in the United States with a correlation coefficient (R) of -0.193 and weighted average of 62.8%. Similarly, the statistical analysis conducted on geographies consisting of 96,349,189 people shows a substantial negative correlation between the proportion of Inupiat and percentage of population with at least college, under 1 year education in the United States with a correlation coefficient (R) of -0.568 and weighted average of 54.6%, a difference of 14.9%.
College, Under 1 year Correlation Summary
| Measurement | Immigrants from Western Africa | Inupiat |
| Minimum | 43.0% | 10.5% |
| Maximum | 76.7% | 75.0% |
| Range | 33.7% | 64.5% |
| Mean | 59.7% | 42.1% |
| Median | 61.2% | 43.6% |
| Interquartile 25% (IQ1) | 54.1% | 27.2% |
| Interquartile 75% (IQ3) | 65.4% | 59.3% |
| Interquartile Range (IQR) | 11.4% | 32.0% |
| Standard Deviation (Sample) | 8.0% | 18.2% |
| Standard Deviation (Population) | 7.9% | 18.0% |
Similar Demographics by College, Under 1 year
Demographics Similar to Immigrants from Western Africa by College, Under 1 year
In terms of college, under 1 year, the demographic groups most similar to Immigrants from Western Africa are Osage (62.7%, a difference of 0.11%), Iroquois (62.6%, a difference of 0.22%), Nonimmigrants (62.9%, a difference of 0.24%), Chippewa (62.6%, a difference of 0.26%), and Liberian (63.0%, a difference of 0.31%).
| Demographics | Rating | Rank | College, Under 1 year |
| Sub-Saharan Africans | 4.4 /100 | #224 | Tragic 63.2% |
| Immigrants | Peru | 4.0 /100 | #225 | Tragic 63.1% |
| Immigrants | Colombia | 4.0 /100 | #226 | Tragic 63.1% |
| Immigrants | Ghana | 3.7 /100 | #227 | Tragic 63.1% |
| Samoans | 3.3 /100 | #228 | Tragic 63.0% |
| Liberians | 3.2 /100 | #229 | Tragic 63.0% |
| Immigrants | Nonimmigrants | 3.0 /100 | #230 | Tragic 62.9% |
| Immigrants | Western Africa | 2.4 /100 | #231 | Tragic 62.8% |
| Osage | 2.2 /100 | #232 | Tragic 62.7% |
| Iroquois | 2.0 /100 | #233 | Tragic 62.6% |
| Chippewa | 2.0 /100 | #234 | Tragic 62.6% |
| Spanish Americans | 1.9 /100 | #235 | Tragic 62.6% |
| Immigrants | Immigrants | 1.7 /100 | #236 | Tragic 62.5% |
| Immigrants | Burma/Myanmar | 1.6 /100 | #237 | Tragic 62.5% |
| French American Indians | 1.5 /100 | #238 | Tragic 62.4% |
Demographics Similar to Inupiat by College, Under 1 year
In terms of college, under 1 year, the demographic groups most similar to Inupiat are Immigrants from the Azores (54.7%, a difference of 0.13%), Pennsylvania German (54.5%, a difference of 0.17%), Immigrants from Central America (54.4%, a difference of 0.32%), Lumbee (54.2%, a difference of 0.73%), and Yuman (55.1%, a difference of 0.85%).
| Demographics | Rating | Rank | College, Under 1 year |
| Cape Verdeans | 0.0 /100 | #328 | Tragic 56.0% |
| Immigrants | Cuba | 0.0 /100 | #329 | Tragic 55.7% |
| Mexicans | 0.0 /100 | #330 | Tragic 55.6% |
| Dominicans | 0.0 /100 | #331 | Tragic 55.5% |
| Immigrants | Yemen | 0.0 /100 | #332 | Tragic 55.3% |
| Yuman | 0.0 /100 | #333 | Tragic 55.1% |
| Immigrants | Azores | 0.0 /100 | #334 | Tragic 54.7% |
| Inupiat | 0.0 /100 | #335 | Tragic 54.6% |
| Pennsylvania Germans | 0.0 /100 | #336 | Tragic 54.5% |
| Immigrants | Central America | 0.0 /100 | #337 | Tragic 54.4% |
| Lumbee | 0.0 /100 | #338 | Tragic 54.2% |
| Immigrants | Dominican Republic | 0.0 /100 | #339 | Tragic 54.0% |
| Spanish American Indians | 0.0 /100 | #340 | Tragic 54.0% |
| Immigrants | Cabo Verde | 0.0 /100 | #341 | Tragic 53.7% |
| Immigrants | Mexico | 0.0 /100 | #342 | Tragic 53.7% |