Immigrants from West Indies vs Immigrants from Congo Householder Income Ages 45 - 64 years
COMPARE
Immigrants from West Indies
Immigrants from Congo
Householder Income Ages 45 - 64 years
Householder Income Ages 45 - 64 years Comparison
Immigrants from West Indies
Immigrants from Congo
$88,164
HOUSEHOLDER INCOME AGES 45 - 64 YEARS
0.2/ 100
METRIC RATING
266th/ 347
METRIC RANK
$77,850
HOUSEHOLDER INCOME AGES 45 - 64 YEARS
0.0/ 100
METRIC RATING
333rd/ 347
METRIC RANK
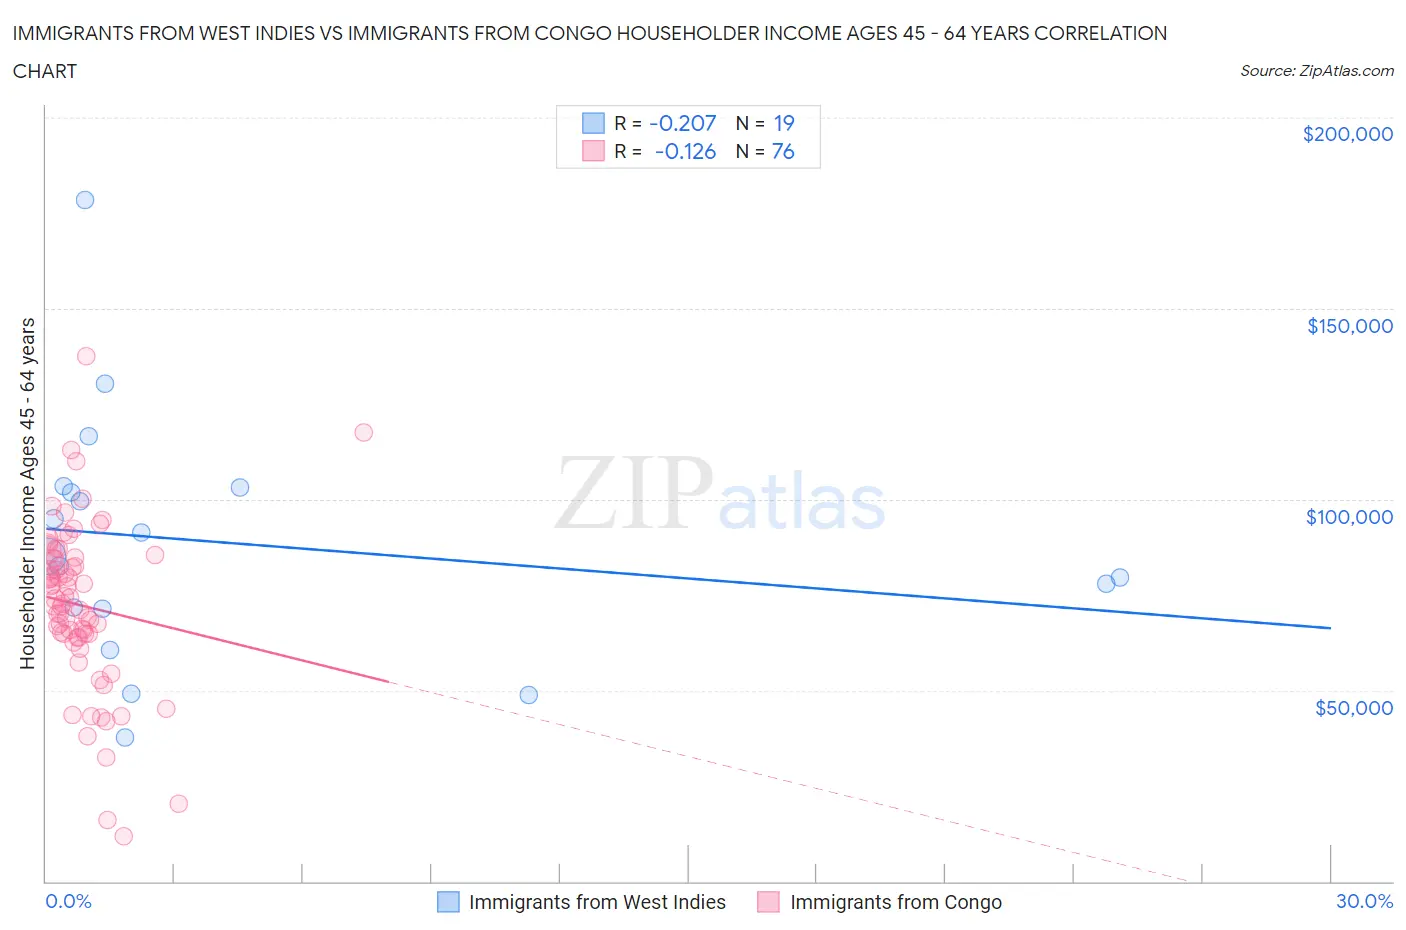
Immigrants from West Indies vs Immigrants from Congo Householder Income Ages 45 - 64 years Correlation Chart
The statistical analysis conducted on geographies consisting of 72,426,675 people shows a weak negative correlation between the proportion of Immigrants from West Indies and household income with householder between the ages 45 and 64 in the United States with a correlation coefficient (R) of -0.207 and weighted average of $88,164. Similarly, the statistical analysis conducted on geographies consisting of 92,054,371 people shows a poor negative correlation between the proportion of Immigrants from Congo and household income with householder between the ages 45 and 64 in the United States with a correlation coefficient (R) of -0.126 and weighted average of $77,850, a difference of 13.3%.
Householder Income Ages 45 - 64 years Correlation Summary
| Measurement | Immigrants from West Indies | Immigrants from Congo |
| Minimum | $37,750 | $11,745 |
| Maximum | $178,534 | $137,368 |
| Range | $140,784 | $125,623 |
| Mean | $88,607 | $72,239 |
| Median | $84,978 | $73,295 |
| Interquartile 25% (IQ1) | $71,324 | $64,310 |
| Interquartile 75% (IQ3) | $103,214 | $84,654 |
| Interquartile Range (IQR) | $31,890 | $20,344 |
| Standard Deviation (Sample) | $32,229 | $21,800 |
| Standard Deviation (Population) | $31,370 | $21,656 |
Similar Demographics by Householder Income Ages 45 - 64 years
Demographics Similar to Immigrants from West Indies by Householder Income Ages 45 - 64 years
In terms of householder income ages 45 - 64 years, the demographic groups most similar to Immigrants from West Indies are Hmong ($88,115, a difference of 0.050%), Jamaican ($88,327, a difference of 0.19%), Osage ($88,390, a difference of 0.26%), Immigrants from Senegal ($88,421, a difference of 0.29%), and Immigrants from Micronesia ($87,864, a difference of 0.34%).
| Demographics | Rating | Rank | Householder Income Ages 45 - 64 years |
| Immigrants | Nicaragua | 0.4 /100 | #259 | Tragic $89,108 |
| Liberians | 0.3 /100 | #260 | Tragic $88,929 |
| Belizeans | 0.3 /100 | #261 | Tragic $88,684 |
| Somalis | 0.3 /100 | #262 | Tragic $88,600 |
| Immigrants | Senegal | 0.3 /100 | #263 | Tragic $88,421 |
| Osage | 0.3 /100 | #264 | Tragic $88,390 |
| Jamaicans | 0.2 /100 | #265 | Tragic $88,327 |
| Immigrants | West Indies | 0.2 /100 | #266 | Tragic $88,164 |
| Hmong | 0.2 /100 | #267 | Tragic $88,115 |
| Immigrants | Micronesia | 0.2 /100 | #268 | Tragic $87,864 |
| Spanish Americans | 0.2 /100 | #269 | Tragic $87,836 |
| Immigrants | Liberia | 0.2 /100 | #270 | Tragic $87,739 |
| Guatemalans | 0.2 /100 | #271 | Tragic $87,705 |
| Cape Verdeans | 0.2 /100 | #272 | Tragic $87,580 |
| Spanish American Indians | 0.2 /100 | #273 | Tragic $87,561 |
Demographics Similar to Immigrants from Congo by Householder Income Ages 45 - 64 years
In terms of householder income ages 45 - 64 years, the demographic groups most similar to Immigrants from Congo are Black/African American ($78,556, a difference of 0.91%), Menominee ($76,903, a difference of 1.2%), Immigrants from Dominican Republic ($78,836, a difference of 1.3%), Creek ($78,960, a difference of 1.4%), and Dutch West Indian ($79,171, a difference of 1.7%).
| Demographics | Rating | Rank | Householder Income Ages 45 - 64 years |
| Dominicans | 0.0 /100 | #326 | Tragic $80,623 |
| Seminole | 0.0 /100 | #327 | Tragic $80,077 |
| Natives/Alaskans | 0.0 /100 | #328 | Tragic $79,816 |
| Dutch West Indians | 0.0 /100 | #329 | Tragic $79,171 |
| Creek | 0.0 /100 | #330 | Tragic $78,960 |
| Immigrants | Dominican Republic | 0.0 /100 | #331 | Tragic $78,836 |
| Blacks/African Americans | 0.0 /100 | #332 | Tragic $78,556 |
| Immigrants | Congo | 0.0 /100 | #333 | Tragic $77,850 |
| Menominee | 0.0 /100 | #334 | Tragic $76,903 |
| Cheyenne | 0.0 /100 | #335 | Tragic $76,362 |
| Arapaho | 0.0 /100 | #336 | Tragic $75,945 |
| Pueblo | 0.0 /100 | #337 | Tragic $75,601 |
| Hopi | 0.0 /100 | #338 | Tragic $75,562 |
| Kiowa | 0.0 /100 | #339 | Tragic $74,815 |
| Immigrants | Yemen | 0.0 /100 | #340 | Tragic $74,575 |