Immigrants from Argentina vs Immigrants from India College, Under 1 year
COMPARE
Immigrants from Argentina
Immigrants from India
College, Under 1 year
College, Under 1 year Comparison
Immigrants from Argentina
Immigrants from India
67.9%
COLLEGE, UNDER 1 YEAR
97.0/ 100
METRIC RATING
100th/ 347
METRIC RANK
74.4%
COLLEGE, UNDER 1 YEAR
100.0/ 100
METRIC RATING
4th/ 347
METRIC RANK
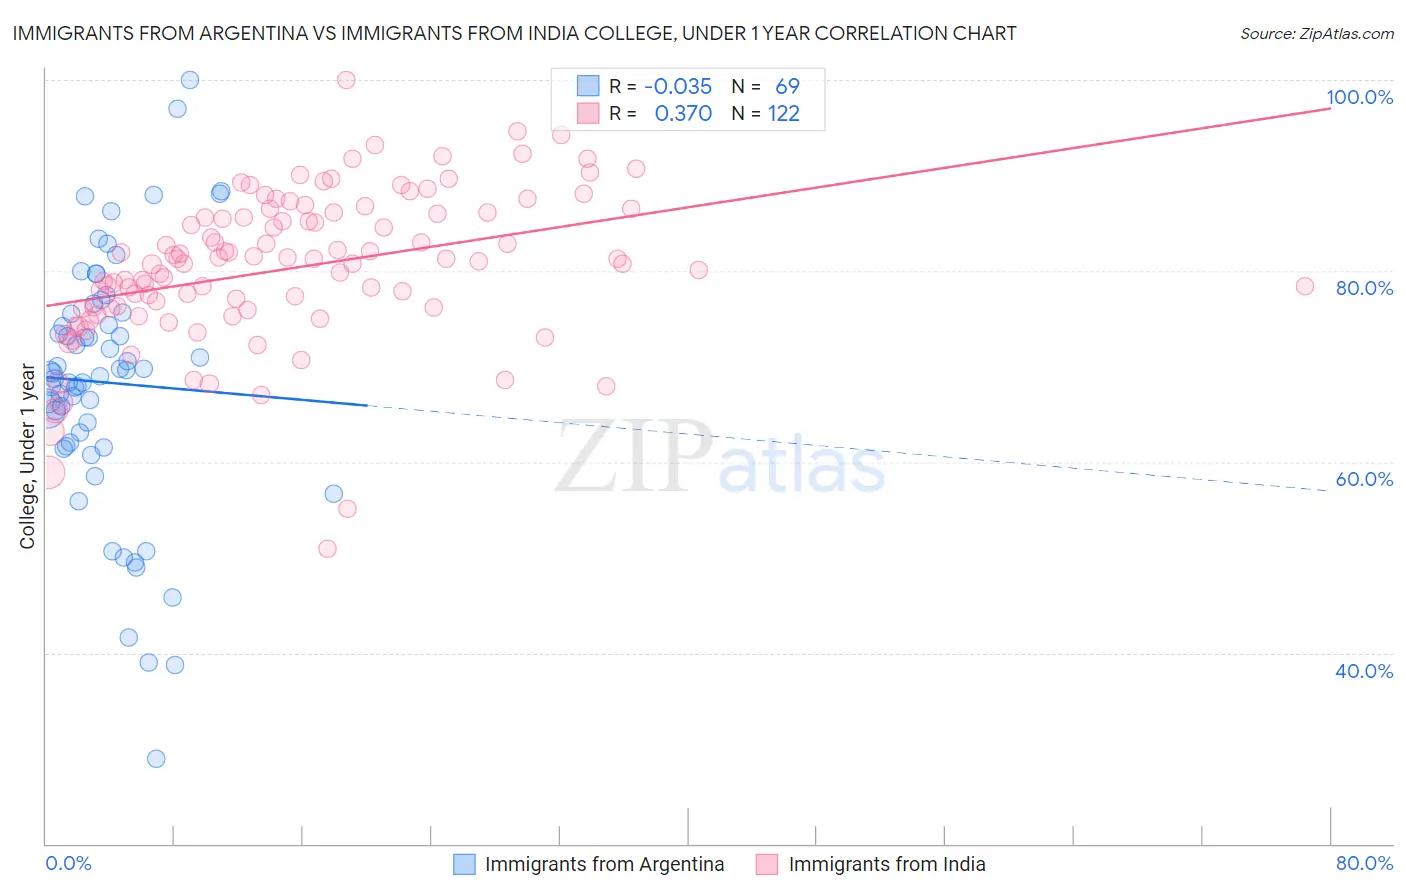
Immigrants from Argentina vs Immigrants from India College, Under 1 year Correlation Chart
The statistical analysis conducted on geographies consisting of 264,437,906 people shows no correlation between the proportion of Immigrants from Argentina and percentage of population with at least college, under 1 year education in the United States with a correlation coefficient (R) of -0.035 and weighted average of 67.9%. Similarly, the statistical analysis conducted on geographies consisting of 434,101,057 people shows a mild positive correlation between the proportion of Immigrants from India and percentage of population with at least college, under 1 year education in the United States with a correlation coefficient (R) of 0.370 and weighted average of 74.4%, a difference of 9.6%.
College, Under 1 year Correlation Summary
| Measurement | Immigrants from Argentina | Immigrants from India |
| Minimum | 29.0% | 50.9% |
| Maximum | 100.0% | 100.0% |
| Range | 71.0% | 49.1% |
| Mean | 68.3% | 80.2% |
| Median | 69.3% | 80.9% |
| Interquartile 25% (IQ1) | 61.9% | 76.0% |
| Interquartile 75% (IQ3) | 75.6% | 85.9% |
| Interquartile Range (IQR) | 13.7% | 9.9% |
| Standard Deviation (Sample) | 13.4% | 8.0% |
| Standard Deviation (Population) | 13.3% | 8.0% |
Similar Demographics by College, Under 1 year
Demographics Similar to Immigrants from Argentina by College, Under 1 year
In terms of college, under 1 year, the demographic groups most similar to Immigrants from Argentina are Immigrants from Bolivia (67.9%, a difference of 0.010%), Paraguayan (67.9%, a difference of 0.030%), Immigrants from Eastern Europe (67.9%, a difference of 0.050%), Palestinian (67.9%, a difference of 0.050%), and Carpatho Rusyn (67.9%, a difference of 0.060%).
| Demographics | Rating | Rank | College, Under 1 year |
| Romanians | 97.9 /100 | #93 | Exceptional 68.2% |
| Armenians | 97.7 /100 | #94 | Exceptional 68.1% |
| Immigrants | Pakistan | 97.5 /100 | #95 | Exceptional 68.0% |
| Jordanians | 97.4 /100 | #96 | Exceptional 68.0% |
| Immigrants | Ethiopia | 97.3 /100 | #97 | Exceptional 68.0% |
| Paraguayans | 97.1 /100 | #98 | Exceptional 67.9% |
| Immigrants | Bolivia | 97.0 /100 | #99 | Exceptional 67.9% |
| Immigrants | Argentina | 97.0 /100 | #100 | Exceptional 67.9% |
| Immigrants | Eastern Europe | 96.9 /100 | #101 | Exceptional 67.9% |
| Palestinians | 96.9 /100 | #102 | Exceptional 67.9% |
| Carpatho Rusyns | 96.8 /100 | #103 | Exceptional 67.9% |
| Immigrants | Western Asia | 96.6 /100 | #104 | Exceptional 67.8% |
| Afghans | 96.6 /100 | #105 | Exceptional 67.8% |
| Immigrants | Croatia | 96.6 /100 | #106 | Exceptional 67.8% |
| Austrians | 96.4 /100 | #107 | Exceptional 67.8% |
Demographics Similar to Immigrants from India by College, Under 1 year
In terms of college, under 1 year, the demographic groups most similar to Immigrants from India are Immigrants from Iran (74.3%, a difference of 0.23%), Immigrants from Taiwan (74.2%, a difference of 0.34%), Immigrants from Singapore (74.8%, a difference of 0.51%), Iranian (74.9%, a difference of 0.56%), and Okinawan (73.7%, a difference of 1.0%).
| Demographics | Rating | Rank | College, Under 1 year |
| Filipinos | 100.0 /100 | #1 | Exceptional 75.5% |
| Iranians | 100.0 /100 | #2 | Exceptional 74.9% |
| Immigrants | Singapore | 100.0 /100 | #3 | Exceptional 74.8% |
| Immigrants | India | 100.0 /100 | #4 | Exceptional 74.4% |
| Immigrants | Iran | 100.0 /100 | #5 | Exceptional 74.3% |
| Immigrants | Taiwan | 100.0 /100 | #6 | Exceptional 74.2% |
| Okinawans | 100.0 /100 | #7 | Exceptional 73.7% |
| Thais | 100.0 /100 | #8 | Exceptional 73.4% |
| Immigrants | Australia | 100.0 /100 | #9 | Exceptional 72.7% |
| Immigrants | Israel | 100.0 /100 | #10 | Exceptional 72.3% |
| Immigrants | South Central Asia | 100.0 /100 | #11 | Exceptional 72.1% |
| Immigrants | Sweden | 100.0 /100 | #12 | Exceptional 72.1% |
| Cypriots | 100.0 /100 | #13 | Exceptional 72.0% |
| Cambodians | 100.0 /100 | #14 | Exceptional 71.9% |
| Burmese | 100.0 /100 | #15 | Exceptional 71.9% |