Immigrants from Uzbekistan vs Immigrants from Ghana College, 1 year or more
COMPARE
Immigrants from Uzbekistan
Immigrants from Ghana
College, 1 year or more
College, 1 year or more Comparison
Immigrants from Uzbekistan
Immigrants from Ghana
61.0%
COLLEGE, 1 YEAR OR MORE
88.0/ 100
METRIC RATING
133rd/ 347
METRIC RANK
57.4%
COLLEGE, 1 YEAR OR MORE
7.7/ 100
METRIC RATING
221st/ 347
METRIC RANK
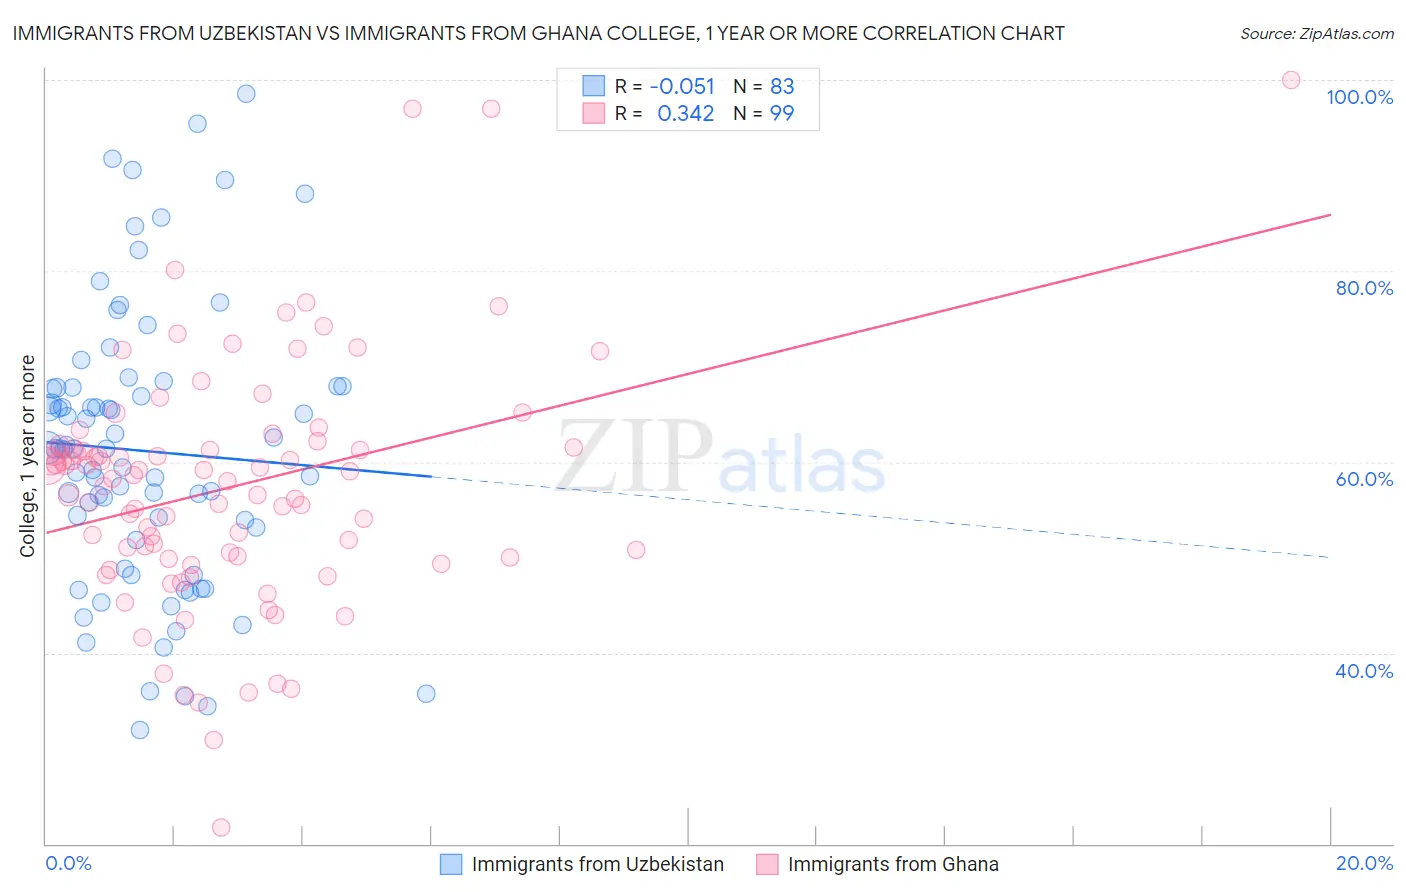
Immigrants from Uzbekistan vs Immigrants from Ghana College, 1 year or more Correlation Chart
The statistical analysis conducted on geographies consisting of 118,765,305 people shows a slight negative correlation between the proportion of Immigrants from Uzbekistan and percentage of population with at least college, 1 year or more education in the United States with a correlation coefficient (R) of -0.051 and weighted average of 61.0%. Similarly, the statistical analysis conducted on geographies consisting of 199,951,982 people shows a mild positive correlation between the proportion of Immigrants from Ghana and percentage of population with at least college, 1 year or more education in the United States with a correlation coefficient (R) of 0.342 and weighted average of 57.4%, a difference of 6.1%.
College, 1 year or more Correlation Summary
| Measurement | Immigrants from Uzbekistan | Immigrants from Ghana |
| Minimum | 31.9% | 21.7% |
| Maximum | 98.6% | 100.0% |
| Range | 66.7% | 78.3% |
| Mean | 61.1% | 57.3% |
| Median | 61.4% | 58.2% |
| Interquartile 25% (IQ1) | 51.9% | 50.0% |
| Interquartile 75% (IQ3) | 67.8% | 61.5% |
| Interquartile Range (IQR) | 15.9% | 11.5% |
| Standard Deviation (Sample) | 14.6% | 12.8% |
| Standard Deviation (Population) | 14.5% | 12.7% |
Similar Demographics by College, 1 year or more
Demographics Similar to Immigrants from Uzbekistan by College, 1 year or more
In terms of college, 1 year or more, the demographic groups most similar to Immigrants from Uzbekistan are Immigrants from Venezuela (61.0%, a difference of 0.010%), Scandinavian (61.0%, a difference of 0.030%), Immigrants from Uganda (60.9%, a difference of 0.070%), Basque (60.9%, a difference of 0.090%), and Slovene (60.9%, a difference of 0.18%).
| Demographics | Rating | Rank | College, 1 year or more |
| Alsatians | 91.3 /100 | #126 | Exceptional 61.3% |
| Immigrants | Eastern Africa | 91.1 /100 | #127 | Exceptional 61.2% |
| Immigrants | Italy | 91.1 /100 | #128 | Exceptional 61.2% |
| Ugandans | 90.7 /100 | #129 | Exceptional 61.2% |
| Italians | 89.5 /100 | #130 | Excellent 61.1% |
| Immigrants | Morocco | 89.5 /100 | #131 | Excellent 61.1% |
| Scandinavians | 88.2 /100 | #132 | Excellent 61.0% |
| Immigrants | Uzbekistan | 88.0 /100 | #133 | Excellent 61.0% |
| Immigrants | Venezuela | 87.9 /100 | #134 | Excellent 61.0% |
| Immigrants | Uganda | 87.4 /100 | #135 | Excellent 60.9% |
| Basques | 87.2 /100 | #136 | Excellent 60.9% |
| Slovenes | 86.5 /100 | #137 | Excellent 60.9% |
| Taiwanese | 84.3 /100 | #138 | Excellent 60.7% |
| Immigrants | Eritrea | 84.3 /100 | #139 | Excellent 60.7% |
| Iraqis | 83.3 /100 | #140 | Excellent 60.7% |
Demographics Similar to Immigrants from Ghana by College, 1 year or more
In terms of college, 1 year or more, the demographic groups most similar to Immigrants from Ghana are Immigrants from Costa Rica (57.5%, a difference of 0.070%), White/Caucasian (57.6%, a difference of 0.19%), Immigrants from Panama (57.6%, a difference of 0.25%), Native Hawaiian (57.6%, a difference of 0.25%), and Subsaharan African (57.3%, a difference of 0.34%).
| Demographics | Rating | Rank | College, 1 year or more |
| Immigrants | Colombia | 11.6 /100 | #214 | Poor 57.8% |
| Tongans | 11.6 /100 | #215 | Poor 57.8% |
| Immigrants | Peru | 10.6 /100 | #216 | Poor 57.7% |
| Immigrants | Panama | 9.1 /100 | #217 | Tragic 57.6% |
| Native Hawaiians | 9.0 /100 | #218 | Tragic 57.6% |
| Whites/Caucasians | 8.7 /100 | #219 | Tragic 57.6% |
| Immigrants | Costa Rica | 8.0 /100 | #220 | Tragic 57.5% |
| Immigrants | Ghana | 7.7 /100 | #221 | Tragic 57.4% |
| Sub-Saharan Africans | 6.1 /100 | #222 | Tragic 57.3% |
| Portuguese | 5.4 /100 | #223 | Tragic 57.2% |
| Hmong | 5.4 /100 | #224 | Tragic 57.2% |
| Vietnamese | 4.7 /100 | #225 | Tragic 57.0% |
| Immigrants | Western Africa | 4.6 /100 | #226 | Tragic 57.0% |
| Immigrants | Immigrants | 4.4 /100 | #227 | Tragic 57.0% |
| Immigrants | Fiji | 4.0 /100 | #228 | Tragic 56.9% |