Immigrants from Cabo Verde vs Immigrants from Ghana College, 1 year or more
COMPARE
Immigrants from Cabo Verde
Immigrants from Ghana
College, 1 year or more
College, 1 year or more Comparison
Immigrants from Cabo Verde
Immigrants from Ghana
48.1%
COLLEGE, 1 YEAR OR MORE
0.0/ 100
METRIC RATING
340th/ 347
METRIC RANK
57.4%
COLLEGE, 1 YEAR OR MORE
7.7/ 100
METRIC RATING
221st/ 347
METRIC RANK
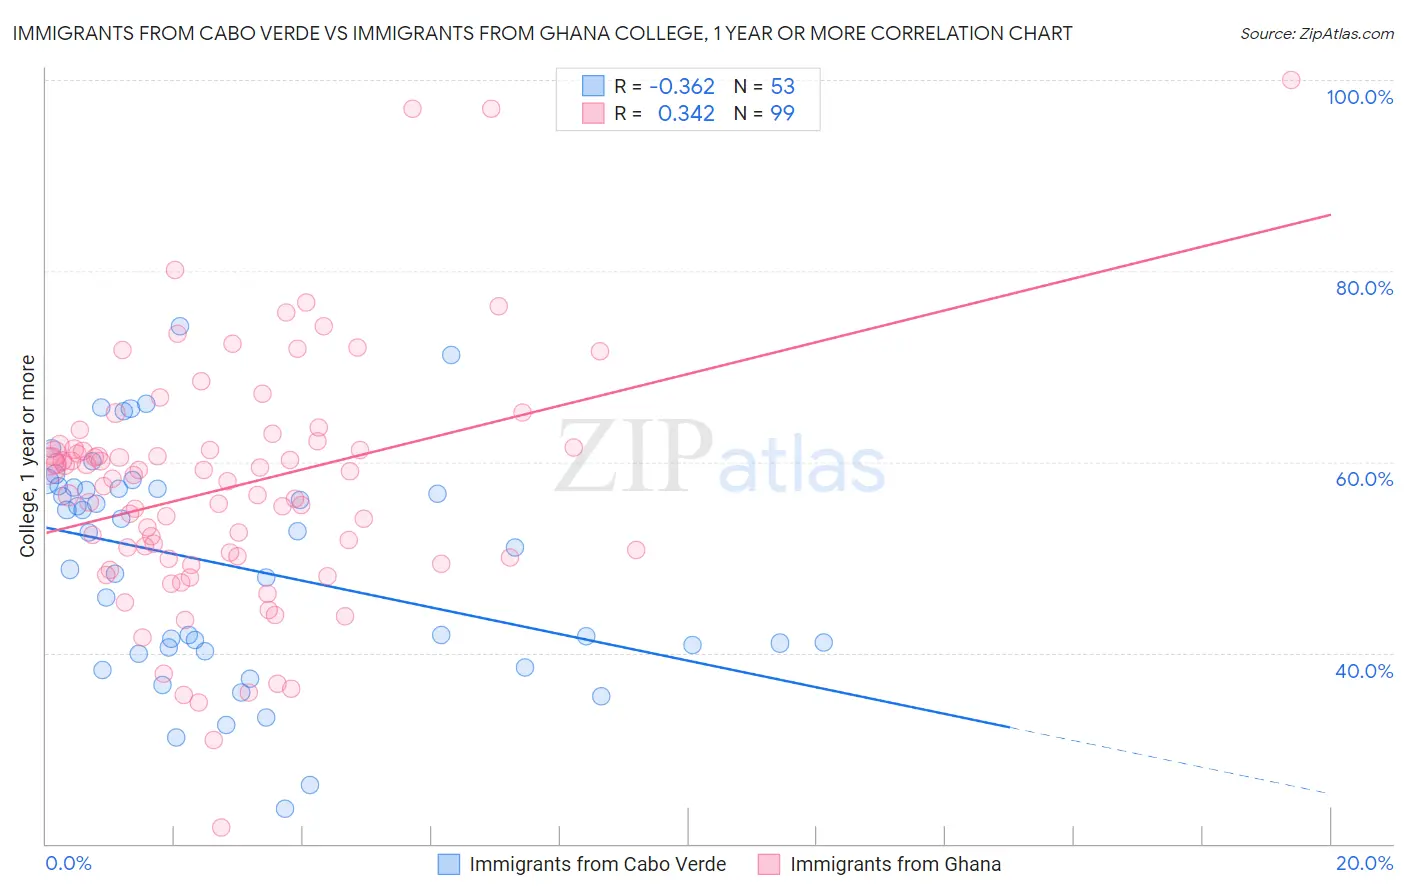
Immigrants from Cabo Verde vs Immigrants from Ghana College, 1 year or more Correlation Chart
The statistical analysis conducted on geographies consisting of 38,158,666 people shows a mild negative correlation between the proportion of Immigrants from Cabo Verde and percentage of population with at least college, 1 year or more education in the United States with a correlation coefficient (R) of -0.362 and weighted average of 48.1%. Similarly, the statistical analysis conducted on geographies consisting of 199,951,982 people shows a mild positive correlation between the proportion of Immigrants from Ghana and percentage of population with at least college, 1 year or more education in the United States with a correlation coefficient (R) of 0.342 and weighted average of 57.4%, a difference of 19.5%.
College, 1 year or more Correlation Summary
| Measurement | Immigrants from Cabo Verde | Immigrants from Ghana |
| Minimum | 23.7% | 21.7% |
| Maximum | 74.3% | 100.0% |
| Range | 50.5% | 78.3% |
| Mean | 49.1% | 57.3% |
| Median | 51.0% | 58.2% |
| Interquartile 25% (IQ1) | 40.4% | 50.0% |
| Interquartile 75% (IQ3) | 57.2% | 61.5% |
| Interquartile Range (IQR) | 16.8% | 11.5% |
| Standard Deviation (Sample) | 11.7% | 12.8% |
| Standard Deviation (Population) | 11.6% | 12.7% |
Similar Demographics by College, 1 year or more
Demographics Similar to Immigrants from Cabo Verde by College, 1 year or more
In terms of college, 1 year or more, the demographic groups most similar to Immigrants from Cabo Verde are Immigrants from the Azores (48.4%, a difference of 0.57%), Immigrants from Central America (48.5%, a difference of 0.83%), Pennsylvania German (48.5%, a difference of 0.88%), Spanish American Indian (48.5%, a difference of 0.89%), and Immigrants from Mexico (47.5%, a difference of 1.2%).
| Demographics | Rating | Rank | College, 1 year or more |
| Immigrants | Dominican Republic | 0.0 /100 | #333 | Tragic 49.1% |
| Lumbee | 0.0 /100 | #334 | Tragic 48.9% |
| Yuman | 0.0 /100 | #335 | Tragic 48.7% |
| Spanish American Indians | 0.0 /100 | #336 | Tragic 48.5% |
| Pennsylvania Germans | 0.0 /100 | #337 | Tragic 48.5% |
| Immigrants | Central America | 0.0 /100 | #338 | Tragic 48.5% |
| Immigrants | Azores | 0.0 /100 | #339 | Tragic 48.4% |
| Immigrants | Cabo Verde | 0.0 /100 | #340 | Tragic 48.1% |
| Immigrants | Mexico | 0.0 /100 | #341 | Tragic 47.5% |
| Inupiat | 0.0 /100 | #342 | Tragic 47.2% |
| Tohono O'odham | 0.0 /100 | #343 | Tragic 47.1% |
| Yakama | 0.0 /100 | #344 | Tragic 46.2% |
| Pima | 0.0 /100 | #345 | Tragic 45.6% |
| Houma | 0.0 /100 | #346 | Tragic 41.2% |
| Yup'ik | 0.0 /100 | #347 | Tragic 39.4% |
Demographics Similar to Immigrants from Ghana by College, 1 year or more
In terms of college, 1 year or more, the demographic groups most similar to Immigrants from Ghana are Immigrants from Costa Rica (57.5%, a difference of 0.070%), White/Caucasian (57.6%, a difference of 0.19%), Immigrants from Panama (57.6%, a difference of 0.25%), Native Hawaiian (57.6%, a difference of 0.25%), and Subsaharan African (57.3%, a difference of 0.34%).
| Demographics | Rating | Rank | College, 1 year or more |
| Immigrants | Colombia | 11.6 /100 | #214 | Poor 57.8% |
| Tongans | 11.6 /100 | #215 | Poor 57.8% |
| Immigrants | Peru | 10.6 /100 | #216 | Poor 57.7% |
| Immigrants | Panama | 9.1 /100 | #217 | Tragic 57.6% |
| Native Hawaiians | 9.0 /100 | #218 | Tragic 57.6% |
| Whites/Caucasians | 8.7 /100 | #219 | Tragic 57.6% |
| Immigrants | Costa Rica | 8.0 /100 | #220 | Tragic 57.5% |
| Immigrants | Ghana | 7.7 /100 | #221 | Tragic 57.4% |
| Sub-Saharan Africans | 6.1 /100 | #222 | Tragic 57.3% |
| Portuguese | 5.4 /100 | #223 | Tragic 57.2% |
| Hmong | 5.4 /100 | #224 | Tragic 57.2% |
| Vietnamese | 4.7 /100 | #225 | Tragic 57.0% |
| Immigrants | Western Africa | 4.6 /100 | #226 | Tragic 57.0% |
| Immigrants | Immigrants | 4.4 /100 | #227 | Tragic 57.0% |
| Immigrants | Fiji | 4.0 /100 | #228 | Tragic 56.9% |