Immigrants from Singapore vs Immigrants from Ghana College, 1 year or more
COMPARE
Immigrants from Singapore
Immigrants from Ghana
College, 1 year or more
College, 1 year or more Comparison
Immigrants from Singapore
Immigrants from Ghana
70.1%
COLLEGE, 1 YEAR OR MORE
100.0/ 100
METRIC RATING
2nd/ 347
METRIC RANK
57.4%
COLLEGE, 1 YEAR OR MORE
7.7/ 100
METRIC RATING
221st/ 347
METRIC RANK
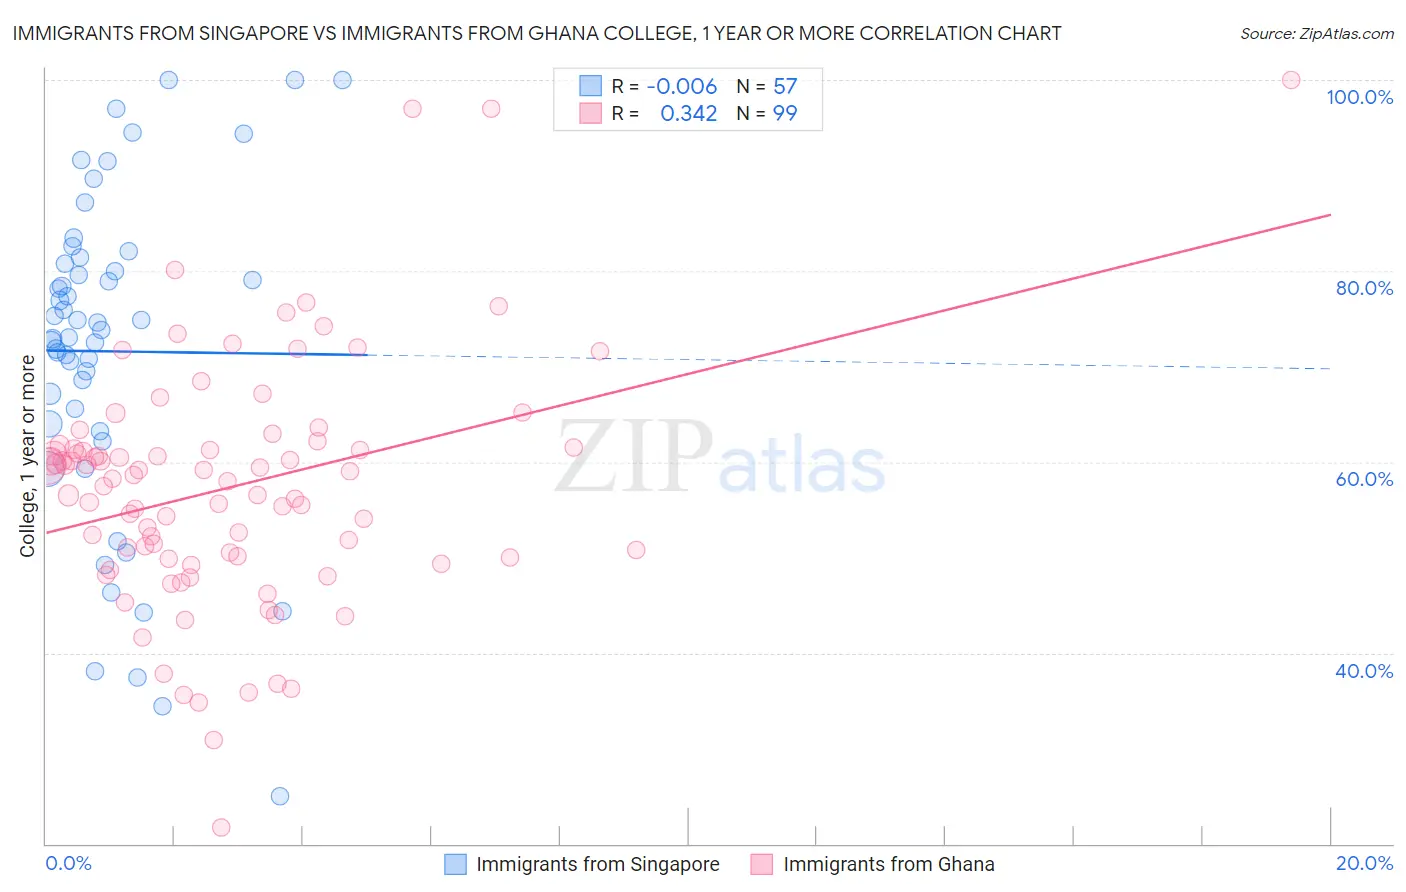
Immigrants from Singapore vs Immigrants from Ghana College, 1 year or more Correlation Chart
The statistical analysis conducted on geographies consisting of 137,521,700 people shows no correlation between the proportion of Immigrants from Singapore and percentage of population with at least college, 1 year or more education in the United States with a correlation coefficient (R) of -0.006 and weighted average of 70.1%. Similarly, the statistical analysis conducted on geographies consisting of 199,951,982 people shows a mild positive correlation between the proportion of Immigrants from Ghana and percentage of population with at least college, 1 year or more education in the United States with a correlation coefficient (R) of 0.342 and weighted average of 57.4%, a difference of 22.1%.
College, 1 year or more Correlation Summary
| Measurement | Immigrants from Singapore | Immigrants from Ghana |
| Minimum | 24.9% | 21.7% |
| Maximum | 100.0% | 100.0% |
| Range | 75.1% | 78.3% |
| Mean | 71.6% | 57.3% |
| Median | 73.8% | 58.2% |
| Interquartile 25% (IQ1) | 63.6% | 50.0% |
| Interquartile 75% (IQ3) | 81.1% | 61.5% |
| Interquartile Range (IQR) | 17.5% | 11.5% |
| Standard Deviation (Sample) | 17.1% | 12.8% |
| Standard Deviation (Population) | 17.0% | 12.7% |
Similar Demographics by College, 1 year or more
Demographics Similar to Immigrants from Singapore by College, 1 year or more
In terms of college, 1 year or more, the demographic groups most similar to Immigrants from Singapore are Iranian (70.0%, a difference of 0.22%), Immigrants from Taiwan (69.6%, a difference of 0.72%), Immigrants from India (69.6%, a difference of 0.72%), Immigrants from Iran (69.5%, a difference of 0.92%), and Filipino (71.0%, a difference of 1.2%).
| Demographics | Rating | Rank | College, 1 year or more |
| Filipinos | 100.0 /100 | #1 | Exceptional 71.0% |
| Immigrants | Singapore | 100.0 /100 | #2 | Exceptional 70.1% |
| Iranians | 100.0 /100 | #3 | Exceptional 70.0% |
| Immigrants | Taiwan | 100.0 /100 | #4 | Exceptional 69.6% |
| Immigrants | India | 100.0 /100 | #5 | Exceptional 69.6% |
| Immigrants | Iran | 100.0 /100 | #6 | Exceptional 69.5% |
| Okinawans | 100.0 /100 | #7 | Exceptional 69.0% |
| Thais | 100.0 /100 | #8 | Exceptional 68.6% |
| Immigrants | Israel | 100.0 /100 | #9 | Exceptional 67.8% |
| Immigrants | Australia | 100.0 /100 | #10 | Exceptional 67.7% |
| Immigrants | South Central Asia | 100.0 /100 | #11 | Exceptional 67.1% |
| Cypriots | 100.0 /100 | #12 | Exceptional 67.0% |
| Immigrants | Sweden | 100.0 /100 | #13 | Exceptional 66.8% |
| Burmese | 100.0 /100 | #14 | Exceptional 66.7% |
| Cambodians | 100.0 /100 | #15 | Exceptional 66.7% |
Demographics Similar to Immigrants from Ghana by College, 1 year or more
In terms of college, 1 year or more, the demographic groups most similar to Immigrants from Ghana are Immigrants from Costa Rica (57.5%, a difference of 0.070%), White/Caucasian (57.6%, a difference of 0.19%), Immigrants from Panama (57.6%, a difference of 0.25%), Native Hawaiian (57.6%, a difference of 0.25%), and Subsaharan African (57.3%, a difference of 0.34%).
| Demographics | Rating | Rank | College, 1 year or more |
| Immigrants | Colombia | 11.6 /100 | #214 | Poor 57.8% |
| Tongans | 11.6 /100 | #215 | Poor 57.8% |
| Immigrants | Peru | 10.6 /100 | #216 | Poor 57.7% |
| Immigrants | Panama | 9.1 /100 | #217 | Tragic 57.6% |
| Native Hawaiians | 9.0 /100 | #218 | Tragic 57.6% |
| Whites/Caucasians | 8.7 /100 | #219 | Tragic 57.6% |
| Immigrants | Costa Rica | 8.0 /100 | #220 | Tragic 57.5% |
| Immigrants | Ghana | 7.7 /100 | #221 | Tragic 57.4% |
| Sub-Saharan Africans | 6.1 /100 | #222 | Tragic 57.3% |
| Portuguese | 5.4 /100 | #223 | Tragic 57.2% |
| Hmong | 5.4 /100 | #224 | Tragic 57.2% |
| Vietnamese | 4.7 /100 | #225 | Tragic 57.0% |
| Immigrants | Western Africa | 4.6 /100 | #226 | Tragic 57.0% |
| Immigrants | Immigrants | 4.4 /100 | #227 | Tragic 57.0% |
| Immigrants | Fiji | 4.0 /100 | #228 | Tragic 56.9% |