Immigrants from Uzbekistan vs Immigrants from South America College, 1 year or more
COMPARE
Immigrants from Uzbekistan
Immigrants from South America
College, 1 year or more
College, 1 year or more Comparison
Immigrants from Uzbekistan
Immigrants from South America
61.0%
COLLEGE, 1 YEAR OR MORE
88.0/ 100
METRIC RATING
133rd/ 347
METRIC RANK
58.4%
COLLEGE, 1 YEAR OR MORE
21.9/ 100
METRIC RATING
202nd/ 347
METRIC RANK
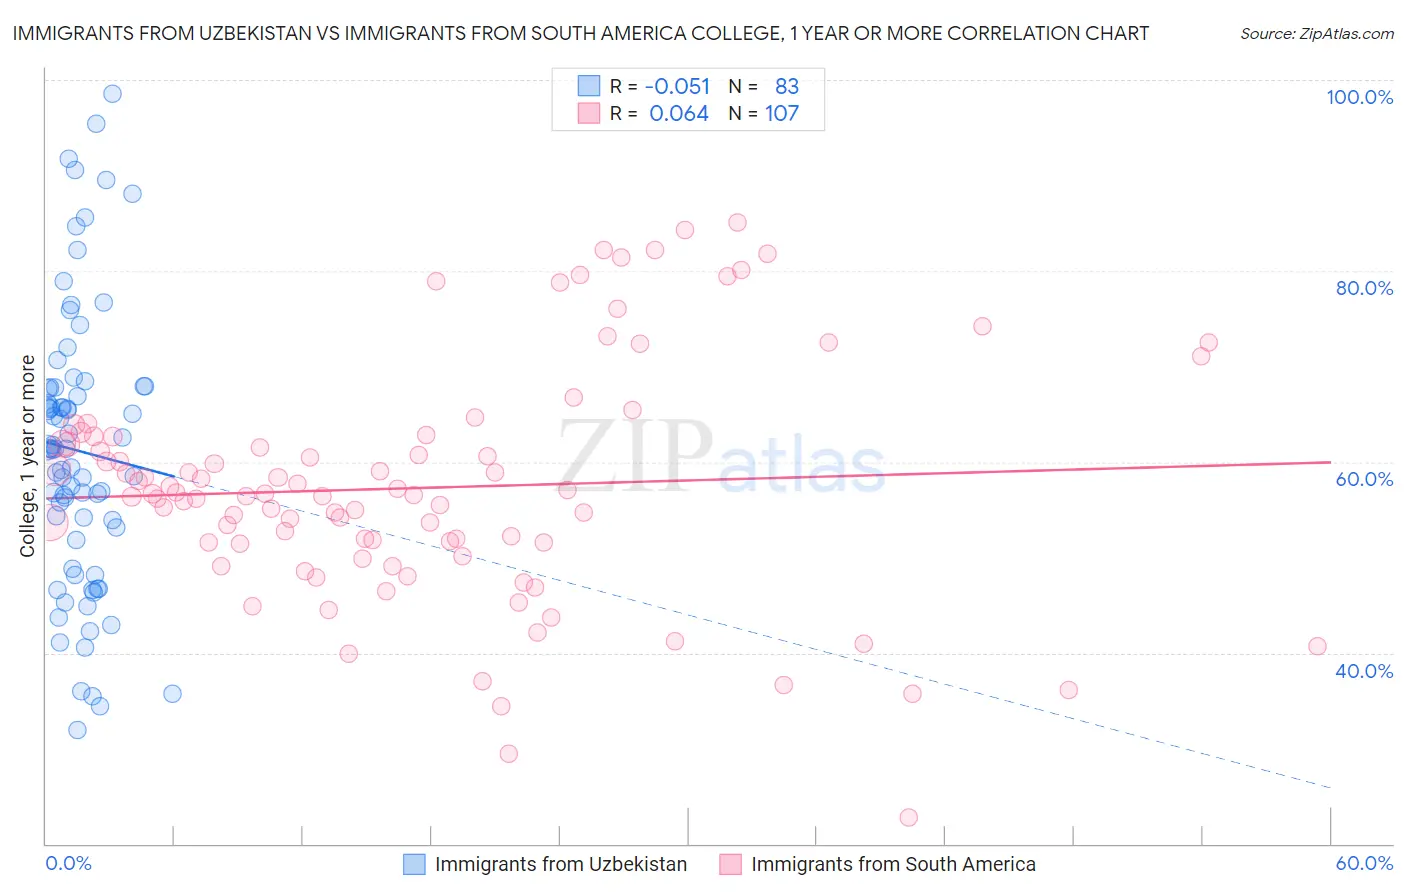
Immigrants from Uzbekistan vs Immigrants from South America College, 1 year or more Correlation Chart
The statistical analysis conducted on geographies consisting of 118,765,305 people shows a slight negative correlation between the proportion of Immigrants from Uzbekistan and percentage of population with at least college, 1 year or more education in the United States with a correlation coefficient (R) of -0.051 and weighted average of 61.0%. Similarly, the statistical analysis conducted on geographies consisting of 486,428,336 people shows a slight positive correlation between the proportion of Immigrants from South America and percentage of population with at least college, 1 year or more education in the United States with a correlation coefficient (R) of 0.064 and weighted average of 58.4%, a difference of 4.4%.
College, 1 year or more Correlation Summary
| Measurement | Immigrants from Uzbekistan | Immigrants from South America |
| Minimum | 31.9% | 22.7% |
| Maximum | 98.6% | 85.1% |
| Range | 66.7% | 62.3% |
| Mean | 61.1% | 57.3% |
| Median | 61.4% | 56.5% |
| Interquartile 25% (IQ1) | 51.9% | 51.4% |
| Interquartile 75% (IQ3) | 67.8% | 62.6% |
| Interquartile Range (IQR) | 15.9% | 11.2% |
| Standard Deviation (Sample) | 14.6% | 12.3% |
| Standard Deviation (Population) | 14.5% | 12.3% |
Similar Demographics by College, 1 year or more
Demographics Similar to Immigrants from Uzbekistan by College, 1 year or more
In terms of college, 1 year or more, the demographic groups most similar to Immigrants from Uzbekistan are Immigrants from Venezuela (61.0%, a difference of 0.010%), Scandinavian (61.0%, a difference of 0.030%), Immigrants from Uganda (60.9%, a difference of 0.070%), Basque (60.9%, a difference of 0.090%), and Slovene (60.9%, a difference of 0.18%).
| Demographics | Rating | Rank | College, 1 year or more |
| Alsatians | 91.3 /100 | #126 | Exceptional 61.3% |
| Immigrants | Eastern Africa | 91.1 /100 | #127 | Exceptional 61.2% |
| Immigrants | Italy | 91.1 /100 | #128 | Exceptional 61.2% |
| Ugandans | 90.7 /100 | #129 | Exceptional 61.2% |
| Italians | 89.5 /100 | #130 | Excellent 61.1% |
| Immigrants | Morocco | 89.5 /100 | #131 | Excellent 61.1% |
| Scandinavians | 88.2 /100 | #132 | Excellent 61.0% |
| Immigrants | Uzbekistan | 88.0 /100 | #133 | Excellent 61.0% |
| Immigrants | Venezuela | 87.9 /100 | #134 | Excellent 61.0% |
| Immigrants | Uganda | 87.4 /100 | #135 | Excellent 60.9% |
| Basques | 87.2 /100 | #136 | Excellent 60.9% |
| Slovenes | 86.5 /100 | #137 | Excellent 60.9% |
| Taiwanese | 84.3 /100 | #138 | Excellent 60.7% |
| Immigrants | Eritrea | 84.3 /100 | #139 | Excellent 60.7% |
| Iraqis | 83.3 /100 | #140 | Excellent 60.7% |
Demographics Similar to Immigrants from South America by College, 1 year or more
In terms of college, 1 year or more, the demographic groups most similar to Immigrants from South America are Nigerian (58.5%, a difference of 0.080%), Ghanaian (58.4%, a difference of 0.090%), Spanish (58.5%, a difference of 0.17%), Slovak (58.5%, a difference of 0.20%), and Panamanian (58.3%, a difference of 0.23%).
| Demographics | Rating | Rank | College, 1 year or more |
| Dutch | 26.2 /100 | #195 | Fair 58.6% |
| Guamanians/Chamorros | 26.2 /100 | #196 | Fair 58.6% |
| Immigrants | Thailand | 26.0 /100 | #197 | Fair 58.6% |
| Immigrants | South Eastern Asia | 25.1 /100 | #198 | Fair 58.5% |
| Slovaks | 24.6 /100 | #199 | Fair 58.5% |
| Spanish | 24.2 /100 | #200 | Fair 58.5% |
| Nigerians | 23.0 /100 | #201 | Fair 58.5% |
| Immigrants | South America | 21.9 /100 | #202 | Fair 58.4% |
| Ghanaians | 20.9 /100 | #203 | Fair 58.4% |
| Panamanians | 19.2 /100 | #204 | Poor 58.3% |
| Immigrants | Zaire | 18.7 /100 | #205 | Poor 58.3% |
| Immigrants | Vietnam | 18.2 /100 | #206 | Poor 58.2% |
| Senegalese | 16.9 /100 | #207 | Poor 58.2% |
| Immigrants | Uruguay | 15.2 /100 | #208 | Poor 58.1% |
| Immigrants | Middle Africa | 14.0 /100 | #209 | Poor 58.0% |