Immigrants from Uzbekistan vs Icelander College, 1 year or more

COMPARE

Immigrants from Uzbekistan
Race
Ancestry
AfghanAfricanAlaska NativeAlaskan AthabascanAlbanianAleutAlsatianAmericanApacheArabArapahoArgentineanArmenianAssyrian/Chaldean/SyriacAustralianAustrianBahamianBangladeshiBarbadianBasqueBelgianBelizeanBermudanBhutaneseBlackfeetBolivianBrazilianBritishBritish West IndianBulgarianBurmeseCajunCambodianCanadianCape VerdeanCarpatho RusynCelticCentral AmericanCentral American IndianCherokeeCheyenneChickasawChileanChineseChippewaChoctawColombianColvilleComancheCosta RicanCreeCreekCroatianCrowCubanCypriotCzechCzechoslovakianDanishDelawareDominicanDutchDutch West IndianEastern EuropeanEcuadorianEgyptianEnglishEstonianEthiopianEuropeanFijianFilipinoFinnishFrenchFrench American IndianFrench CanadianGermanGerman RussianGhanaianGreekGuamanian/ChamorroGuatemalanGuyaneseHaitianHmongHonduranHopiHoumaHungarianIndian (Asian)IndonesianInupiatIranianIraqiIrishIroquoisIsraeliItalianJamaicanJapaneseJordanianKenyanKiowaKoreanLaotianLatvianLebaneseLiberianLithuanianLumbeeLuxembourgerMacedonianMalaysianMalteseMarshalleseMenomineeMexicanMexican American IndianMongolianMoroccanNative HawaiianNavajoNepaleseNew ZealanderNicaraguanNigerianNorthern EuropeanNorwegianOkinawanOsageOttawaPaiutePakistaniPalestinianPanamanianParaguayanPennsylvania GermanPeruvianPimaPolishPortuguesePotawatomiPuebloPuerto RicanPuget Sound SalishRomanianRussianSalvadoranSamoanScandinavianScotch-IrishScottishSeminoleSenegaleseSerbianShoshoneSierra LeoneanSiouxSlavicSlovakSloveneSomaliSouth AfricanSouth AmericanSouth American IndianSoviet UnionSpaniardSpanishSpanish AmericanSpanish American IndianSri LankanSubsaharan AfricanSudaneseSwedishSwissSyrianTaiwaneseThaiTlingit-HaidaTohono O'OdhamTonganTrinidadian and TobagonianTsimshianTurkishU.S. Virgin IslanderUgandanUkrainianUruguayanUteVenezuelanVietnameseWelshWest IndianYakamaYaquiYugoslavianYumanYup'ikZimbabwean
Immigration
NonimmigrantsImmigrantsAfghanistanAfricaAlbaniaArgentinaArmeniaAsiaAustraliaAustriaBahamasBangladeshBarbadosBelarusBelgiumBelizeBoliviaBosnia and HerzegovinaBrazilBulgariaBurma/MyanmarCabo VerdeCambodiaCameroonCanadaCaribbeanCentral AmericaChileChinaColombiaCongoCosta RicaCroatiaCubaCzechoslovakiaDenmarkDominicaDominican RepublicEastern AfricaEastern AsiaEastern EuropeEcuadorEgyptEl SalvadorEnglandEritreaEthiopiaEuropeFijiFranceGermanyGhanaGreeceGrenadaGuatemalaGuyanaHaitiHondurasHong KongHungaryIndiaIndonesiaIranIraqIrelandIsraelItalyJamaicaJapanJordanKazakhstanKenyaKoreaKuwaitLaosLatin AmericaLatviaLebanonLiberiaLithuaniaMalaysiaMexicoMicronesiaMiddle AfricaMoldovaMoroccoNepalNetherlandsNicaraguaNigeriaNorth AmericaNorth MacedoniaNorthern AfricaNorthern EuropeNorwayOceaniaPakistanPanamaPeruPhilippinesPolandPortugalRomaniaRussiaSaudi ArabiaScotlandSenegalSerbiaSierra LeoneSingaporeSomaliaSouth AfricaSouth AmericaSouth Central AsiaSouth Eastern AsiaSouthern EuropeSpainSri LankaSt. Vincent and the GrenadinesSudanSwedenSwitzerlandSyriaTaiwanThailandTrinidad and TobagoTurkeyUgandaUkraineUruguayUzbekistanVenezuelaVietnamWest IndiesWestern AfricaWestern AsiaWestern EuropeYemenZaireZimbabweAzores
Icelander
Race
Ancestry
AfghanAfricanAlaska NativeAlaskan AthabascanAlbanianAleutAlsatianAmericanApacheArabArapahoArgentineanArmenianAssyrian/Chaldean/SyriacAustralianAustrianBahamianBangladeshiBarbadianBasqueBelgianBelizeanBermudanBhutaneseBlackfeetBolivianBrazilianBritishBritish West IndianBulgarianBurmeseCajunCambodianCanadianCape VerdeanCarpatho RusynCelticCentral AmericanCentral American IndianCherokeeCheyenneChickasawChileanChineseChippewaChoctawColombianColvilleComancheCosta RicanCreeCreekCroatianCrowCubanCypriotCzechCzechoslovakianDanishDelawareDominicanDutchDutch West IndianEastern EuropeanEcuadorianEgyptianEnglishEstonianEthiopianEuropeanFijianFilipinoFinnishFrenchFrench American IndianFrench CanadianGermanGerman RussianGhanaianGreekGuamanian/ChamorroGuatemalanGuyaneseHaitianHmongHonduranHopiHoumaHungarianIcelanderIndian (Asian)IndonesianInupiatIranianIraqiIrishIroquoisIsraeliItalianJamaicanJapaneseJordanianKenyanKiowaKoreanLaotianLatvianLebaneseLiberianLithuanianLumbeeLuxembourgerMacedonianMalaysianMalteseMarshalleseMenomineeMexicanMexican American IndianMongolianMoroccanNative HawaiianNavajoNepaleseNew ZealanderNicaraguanNigerianNorthern EuropeanNorwegianOkinawanOsageOttawaPaiutePakistaniPalestinianPanamanianParaguayanPennsylvania GermanPeruvianPimaPolishPortuguesePotawatomiPuebloPuerto RicanPuget Sound SalishRomanianRussianSalvadoranSamoanScandinavianScotch-IrishScottishSeminoleSenegaleseSerbianShoshoneSierra LeoneanSiouxSlavicSlovakSloveneSomaliSouth AfricanSouth AmericanSouth American IndianSoviet UnionSpaniardSpanishSpanish AmericanSpanish American IndianSri LankanSubsaharan AfricanSudaneseSwedishSwissSyrianTaiwaneseThaiTlingit-HaidaTohono O'OdhamTonganTrinidadian and TobagonianTsimshianTurkishU.S. Virgin IslanderUgandanUkrainianUruguayanUteVenezuelanVietnameseWelshWest IndianYakamaYaquiYugoslavianYumanYup'ikZimbabwean
Immigration
NonimmigrantsImmigrantsAfghanistanAfricaAlbaniaArgentinaArmeniaAsiaAustraliaAustriaBahamasBangladeshBarbadosBelarusBelgiumBelizeBoliviaBosnia and HerzegovinaBrazilBulgariaBurma/MyanmarCabo VerdeCambodiaCameroonCanadaCaribbeanCentral AmericaChileChinaColombiaCongoCosta RicaCroatiaCubaCzechoslovakiaDenmarkDominicaDominican RepublicEastern AfricaEastern AsiaEastern EuropeEcuadorEgyptEl SalvadorEnglandEritreaEthiopiaEuropeFijiFranceGermanyGhanaGreeceGrenadaGuatemalaGuyanaHaitiHondurasHong KongHungaryIndiaIndonesiaIranIraqIrelandIsraelItalyJamaicaJapanJordanKazakhstanKenyaKoreaKuwaitLaosLatin AmericaLatviaLebanonLiberiaLithuaniaMalaysiaMexicoMicronesiaMiddle AfricaMoldovaMoroccoNepalNetherlandsNicaraguaNigeriaNorth AmericaNorth MacedoniaNorthern AfricaNorthern EuropeNorwayOceaniaPakistanPanamaPeruPhilippinesPolandPortugalRomaniaRussiaSaudi ArabiaScotlandSenegalSerbiaSierra LeoneSingaporeSomaliaSouth AfricaSouth AmericaSouth Central AsiaSouth Eastern AsiaSouthern EuropeSpainSri LankaSt. Vincent and the GrenadinesSudanSwedenSwitzerlandSyriaTaiwanThailandTrinidad and TobagoTurkeyUgandaUkraineUruguayVenezuelaVietnamWest IndiesWestern AfricaWestern AsiaWestern EuropeYemenZaireZimbabweAzores
College, 1 year or more
Income
Poverty
Unemployment
Labor Participation
Family Structure
Vehicle Availability
Education Level
Disability

College, 1 year or more Comparison

Immigrants from Uzbekistan

Icelanders

Excellent
Exceptional
61.0%
COLLEGE, 1 YEAR OR MORE
88.0/ 100
METRIC RATING
133rd/ 347
METRIC RANK
62.1%
COLLEGE, 1 YEAR OR MORE
96.8/ 100
METRIC RATING
100th/ 347
METRIC RANK

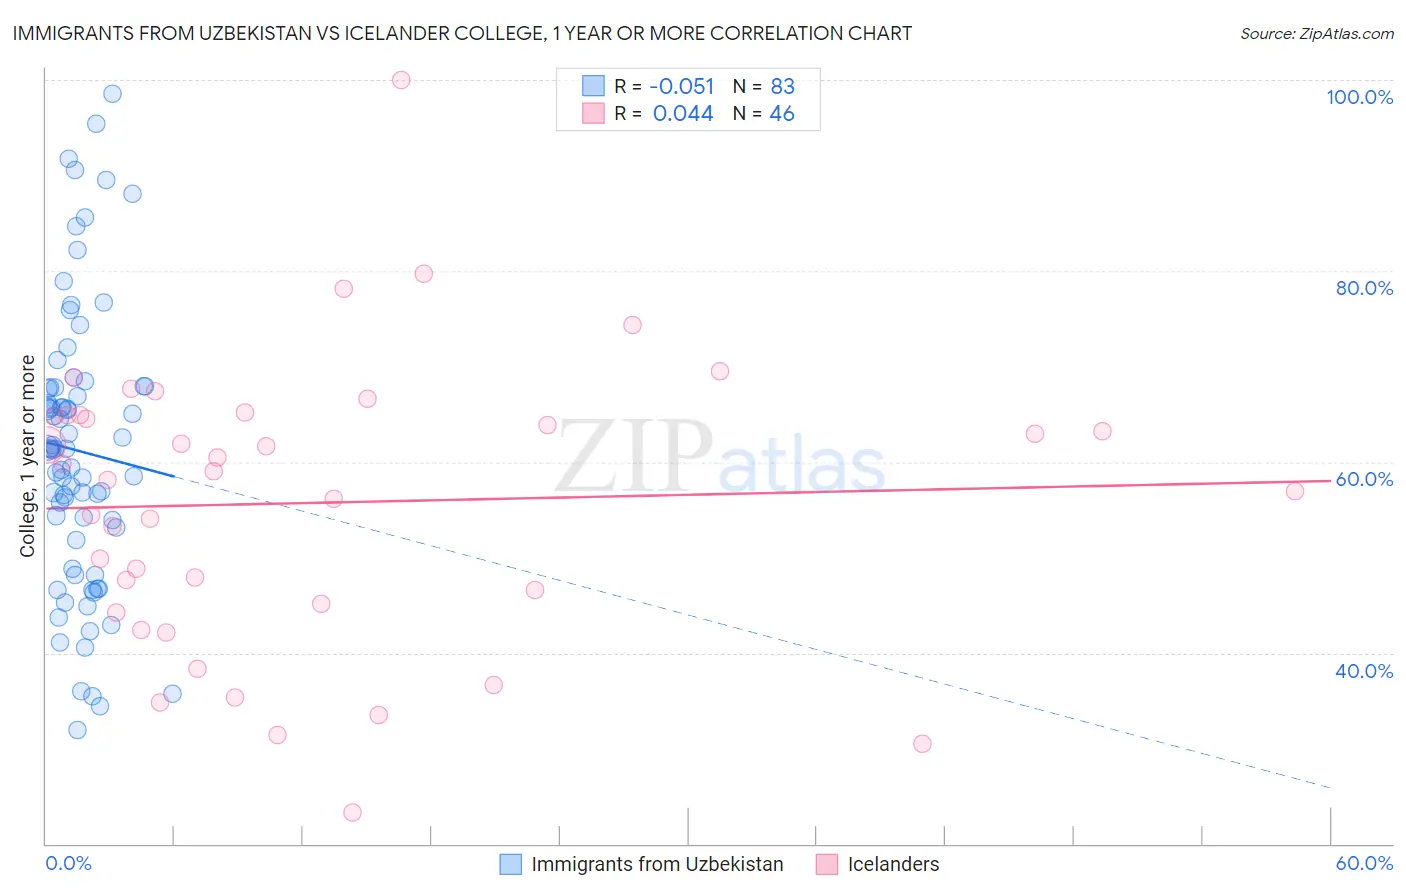
Immigrants from Uzbekistan vs Icelander College, 1 year or more Correlation Chart

The statistical analysis conducted on geographies consisting of 118,765,305 people shows a slight negative correlation between the proportion of Immigrants from Uzbekistan and percentage of population with at least college, 1 year or more education in the United States with a correlation coefficient (R) of -0.051 and weighted average of 61.0%. Similarly, the statistical analysis conducted on geographies consisting of 159,668,975 people shows no correlation between the proportion of Icelanders and percentage of population with at least college, 1 year or more education in the United States with a correlation coefficient (R) of 0.044 and weighted average of 62.1%, a difference of 1.8%.
Immigrants from Uzbekistan vs Icelander College, 1 year or more

College, 1 year or more Correlation Summary

MeasurementImmigrants from UzbekistanIcelander
Minimum31.9%23.3%
Maximum98.6%100.0%
Range66.7%76.7%
Mean61.1%55.7%
Median61.4%58.5%
Interquartile 25% (IQ1)51.9%45.2%
Interquartile 75% (IQ3)67.8%64.9%
Interquartile Range (IQR)15.9%19.7%
Standard Deviation (Sample)14.6%15.0%
Standard Deviation (Population)14.5%14.8%

Similar Demographics by College, 1 year or more

Demographics Similar to Immigrants from Uzbekistan by College, 1 year or more

In terms of college, 1 year or more, the demographic groups most similar to Immigrants from Uzbekistan are Immigrants from Venezuela (61.0%, a difference of 0.010%), Scandinavian (61.0%, a difference of 0.030%), Immigrants from Uganda (60.9%, a difference of 0.070%), Basque (60.9%, a difference of 0.090%), and Slovene (60.9%, a difference of 0.18%).
DemographicsRating | RankCollege, 1 year or more
Alsatians
91.3
/100
|
#126
Exceptional
61.3%
Immigrants | Eastern Africa
91.1
/100
|
#127
Exceptional
61.2%
Immigrants | Italy
91.1
/100
|
#128
Exceptional
61.2%
Ugandans
90.7
/100
|
#129
Exceptional
61.2%
Italians
89.5
/100
|
#130
Excellent
61.1%
Immigrants | Morocco
89.5
/100
|
#131
Excellent
61.1%
Scandinavians
88.2
/100
|
#132
Excellent
61.0%
Immigrants | Uzbekistan
88.0
/100
|
#133
Excellent
61.0%
Immigrants | Venezuela
87.9
/100
|
#134
Excellent
61.0%
Immigrants | Uganda
87.4
/100
|
#135
Excellent
60.9%
Basques
87.2
/100
|
#136
Excellent
60.9%
Slovenes
86.5
/100
|
#137
Excellent
60.9%
Taiwanese
84.3
/100
|
#138
Excellent
60.7%
Immigrants | Eritrea
84.3
/100
|
#139
Excellent
60.7%
Iraqis
83.3
/100
|
#140
Excellent
60.7%

Demographics Similar to Icelanders by College, 1 year or more

In terms of college, 1 year or more, the demographic groups most similar to Icelanders are Swedish (62.1%, a difference of 0.0%), Luxembourger (62.1%, a difference of 0.020%), Afghan (62.0%, a difference of 0.13%), Chilean (62.0%, a difference of 0.15%), and Croatian (62.2%, a difference of 0.16%).
DemographicsRating | RankCollege, 1 year or more
Romanians
97.7
/100
|
#93
Exceptional
62.4%
Immigrants | Croatia
97.6
/100
|
#94
Exceptional
62.3%
British
97.4
/100
|
#95
Exceptional
62.3%
Chinese
97.2
/100
|
#96
Exceptional
62.2%
Jordanians
97.2
/100
|
#97
Exceptional
62.2%
Carpatho Rusyns
97.2
/100
|
#98
Exceptional
62.2%
Croatians
97.1
/100
|
#99
Exceptional
62.2%
Icelanders
96.8
/100
|
#100
Exceptional
62.1%
Swedes
96.8
/100
|
#101
Exceptional
62.1%
Luxembourgers
96.7
/100
|
#102
Exceptional
62.1%
Afghans
96.4
/100
|
#103
Exceptional
62.0%
Chileans
96.4
/100
|
#104
Exceptional
62.0%
Immigrants | Nepal
96.3
/100
|
#105
Exceptional
62.0%
Palestinians
96.3
/100
|
#106
Exceptional
62.0%
Immigrants | Ukraine
95.8
/100
|
#107
Exceptional
61.9%