Immigrants from Uruguay vs Immigrants from Greece College, 1 year or more
COMPARE
Immigrants from Uruguay
Immigrants from Greece
College, 1 year or more
College, 1 year or more Comparison
Immigrants from Uruguay
Immigrants from Greece
58.1%
COLLEGE, 1 YEAR OR MORE
15.2/ 100
METRIC RATING
208th/ 347
METRIC RANK
63.3%
COLLEGE, 1 YEAR OR MORE
99.3/ 100
METRIC RATING
68th/ 347
METRIC RANK
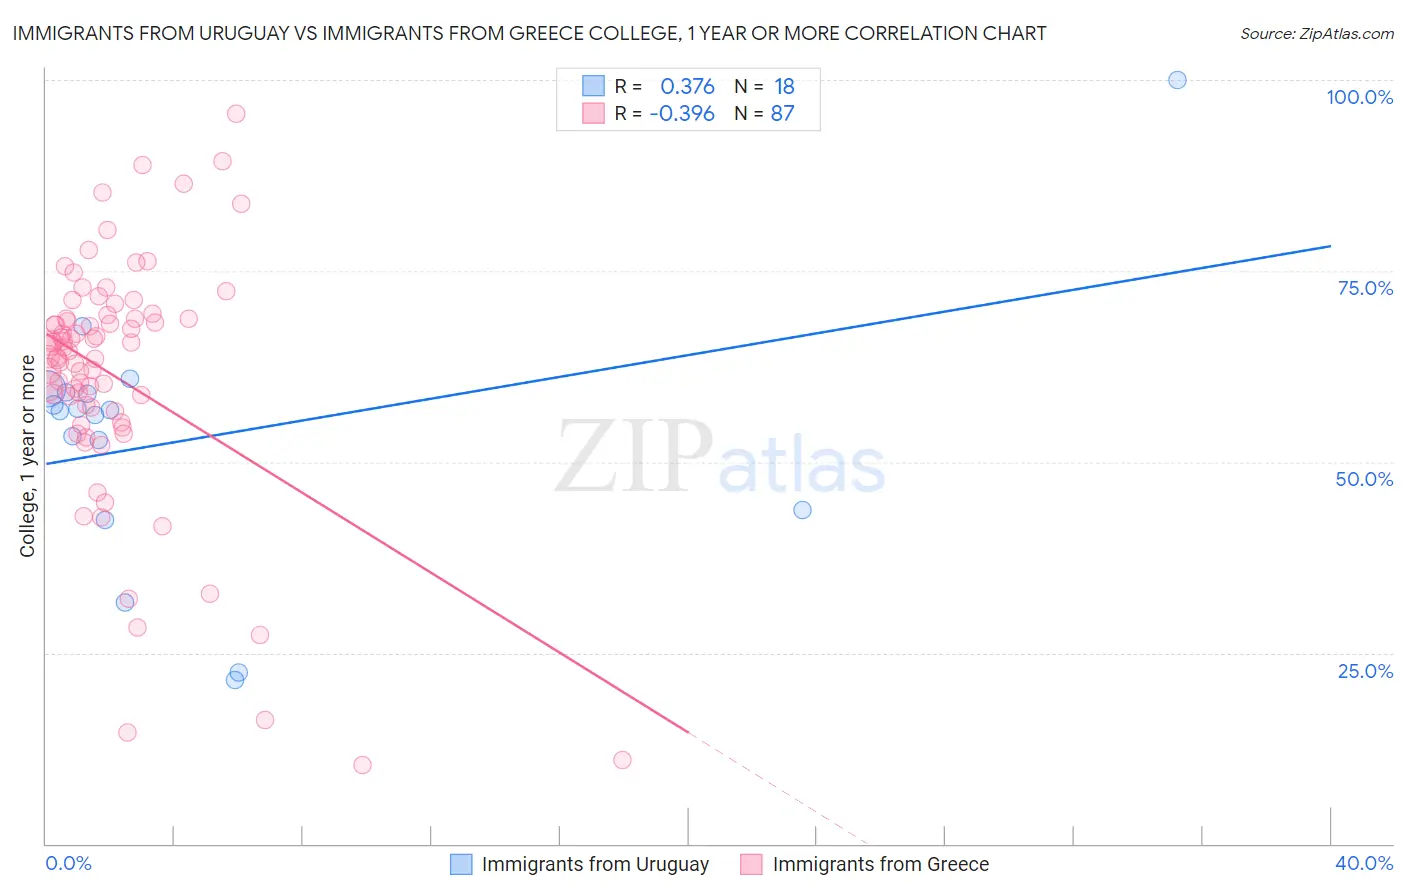
Immigrants from Uruguay vs Immigrants from Greece College, 1 year or more Correlation Chart
The statistical analysis conducted on geographies consisting of 133,259,667 people shows a mild positive correlation between the proportion of Immigrants from Uruguay and percentage of population with at least college, 1 year or more education in the United States with a correlation coefficient (R) of 0.376 and weighted average of 58.1%. Similarly, the statistical analysis conducted on geographies consisting of 216,878,684 people shows a mild negative correlation between the proportion of Immigrants from Greece and percentage of population with at least college, 1 year or more education in the United States with a correlation coefficient (R) of -0.396 and weighted average of 63.3%, a difference of 9.0%.
College, 1 year or more Correlation Summary
| Measurement | Immigrants from Uruguay | Immigrants from Greece |
| Minimum | 21.5% | 10.3% |
| Maximum | 100.0% | 95.6% |
| Range | 78.5% | 85.3% |
| Mean | 53.2% | 61.2% |
| Median | 56.7% | 64.4% |
| Interquartile 25% (IQ1) | 43.8% | 56.6% |
| Interquartile 75% (IQ3) | 59.1% | 68.8% |
| Interquartile Range (IQR) | 15.3% | 12.2% |
| Standard Deviation (Sample) | 17.6% | 16.4% |
| Standard Deviation (Population) | 17.1% | 16.3% |
Similar Demographics by College, 1 year or more
Demographics Similar to Immigrants from Uruguay by College, 1 year or more
In terms of college, 1 year or more, the demographic groups most similar to Immigrants from Uruguay are Immigrants from Middle Africa (58.0%, a difference of 0.13%), Senegalese (58.2%, a difference of 0.17%), Tsimshian (57.9%, a difference of 0.19%), Immigrants from Nigeria (57.9%, a difference of 0.22%), and Immigrants from Vietnam (58.2%, a difference of 0.29%).
| Demographics | Rating | Rank | College, 1 year or more |
| Nigerians | 23.0 /100 | #201 | Fair 58.5% |
| Immigrants | South America | 21.9 /100 | #202 | Fair 58.4% |
| Ghanaians | 20.9 /100 | #203 | Fair 58.4% |
| Panamanians | 19.2 /100 | #204 | Poor 58.3% |
| Immigrants | Zaire | 18.7 /100 | #205 | Poor 58.3% |
| Immigrants | Vietnam | 18.2 /100 | #206 | Poor 58.2% |
| Senegalese | 16.9 /100 | #207 | Poor 58.2% |
| Immigrants | Uruguay | 15.2 /100 | #208 | Poor 58.1% |
| Immigrants | Middle Africa | 14.0 /100 | #209 | Poor 58.0% |
| Tsimshian | 13.5 /100 | #210 | Poor 57.9% |
| Immigrants | Nigeria | 13.3 /100 | #211 | Poor 57.9% |
| Immigrants | Senegal | 11.8 /100 | #212 | Poor 57.8% |
| French Canadians | 11.8 /100 | #213 | Poor 57.8% |
| Immigrants | Colombia | 11.6 /100 | #214 | Poor 57.8% |
| Tongans | 11.6 /100 | #215 | Poor 57.8% |
Demographics Similar to Immigrants from Greece by College, 1 year or more
In terms of college, 1 year or more, the demographic groups most similar to Immigrants from Greece are Immigrants from Zimbabwe (63.3%, a difference of 0.0%), Immigrants from Romania (63.3%, a difference of 0.020%), Immigrants from Europe (63.3%, a difference of 0.030%), Argentinean (63.2%, a difference of 0.10%), and Maltese (63.4%, a difference of 0.14%).
| Demographics | Rating | Rank | College, 1 year or more |
| Bolivians | 99.5 /100 | #61 | Exceptional 63.5% |
| Immigrants | Indonesia | 99.5 /100 | #62 | Exceptional 63.5% |
| Immigrants | Scotland | 99.4 /100 | #63 | Exceptional 63.4% |
| Immigrants | Spain | 99.4 /100 | #64 | Exceptional 63.4% |
| Maltese | 99.3 /100 | #65 | Exceptional 63.4% |
| Immigrants | Europe | 99.3 /100 | #66 | Exceptional 63.3% |
| Immigrants | Romania | 99.3 /100 | #67 | Exceptional 63.3% |
| Immigrants | Greece | 99.3 /100 | #68 | Exceptional 63.3% |
| Immigrants | Zimbabwe | 99.3 /100 | #69 | Exceptional 63.3% |
| Argentineans | 99.2 /100 | #70 | Exceptional 63.2% |
| Immigrants | Canada | 99.1 /100 | #71 | Exceptional 63.1% |
| Egyptians | 99.0 /100 | #72 | Exceptional 63.1% |
| Immigrants | Moldova | 99.0 /100 | #73 | Exceptional 63.0% |
| Immigrants | North America | 99.0 /100 | #74 | Exceptional 63.0% |
| Armenians | 98.9 /100 | #75 | Exceptional 63.0% |