Immigrants from Uganda vs Alaska Native Bachelor's Degree
COMPARE
Immigrants from Uganda
Alaska Native
Bachelor's Degree
Bachelor's Degree Comparison
Immigrants from Uganda
Alaska Natives
40.7%
BACHELOR'S DEGREE
95.7/ 100
METRIC RATING
116th/ 347
METRIC RANK
29.4%
BACHELOR'S DEGREE
0.0/ 100
METRIC RATING
313th/ 347
METRIC RANK
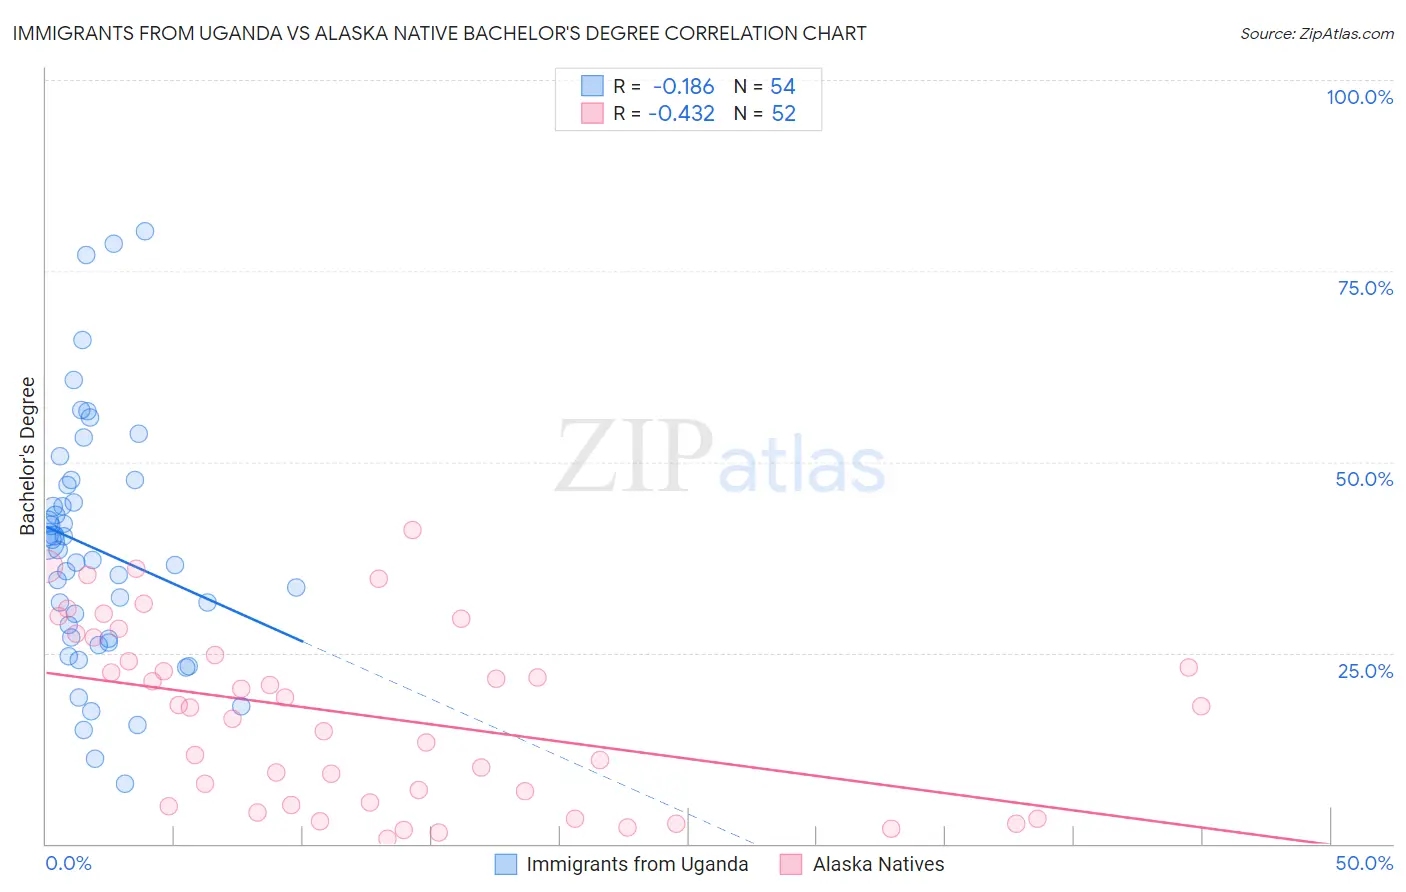
Immigrants from Uganda vs Alaska Native Bachelor's Degree Correlation Chart
The statistical analysis conducted on geographies consisting of 125,980,358 people shows a poor negative correlation between the proportion of Immigrants from Uganda and percentage of population with at least bachelor's degree education in the United States with a correlation coefficient (R) of -0.186 and weighted average of 40.7%. Similarly, the statistical analysis conducted on geographies consisting of 76,776,170 people shows a moderate negative correlation between the proportion of Alaska Natives and percentage of population with at least bachelor's degree education in the United States with a correlation coefficient (R) of -0.432 and weighted average of 29.4%, a difference of 38.6%.
Bachelor's Degree Correlation Summary
| Measurement | Immigrants from Uganda | Alaska Native |
| Minimum | 7.9% | 0.66% |
| Maximum | 80.2% | 41.1% |
| Range | 72.3% | 40.4% |
| Mean | 38.5% | 16.8% |
| Median | 37.9% | 17.9% |
| Interquartile 25% (IQ1) | 26.9% | 5.2% |
| Interquartile 75% (IQ3) | 47.0% | 25.9% |
| Interquartile Range (IQR) | 20.2% | 20.6% |
| Standard Deviation (Sample) | 16.2% | 11.5% |
| Standard Deviation (Population) | 16.0% | 11.4% |
Similar Demographics by Bachelor's Degree
Demographics Similar to Immigrants from Uganda by Bachelor's Degree
In terms of bachelor's degree, the demographic groups most similar to Immigrants from Uganda are Palestinian (40.7%, a difference of 0.050%), Austrian (40.6%, a difference of 0.10%), Croatian (40.6%, a difference of 0.12%), Afghan (40.8%, a difference of 0.29%), and Brazilian (40.8%, a difference of 0.32%).
| Demographics | Rating | Rank | Bachelor's Degree |
| Arabs | 96.6 /100 | #109 | Exceptional 40.9% |
| Albanians | 96.5 /100 | #110 | Exceptional 40.9% |
| Immigrants | Chile | 96.4 /100 | #111 | Exceptional 40.8% |
| Ugandans | 96.3 /100 | #112 | Exceptional 40.8% |
| Brazilians | 96.3 /100 | #113 | Exceptional 40.8% |
| Afghans | 96.2 /100 | #114 | Exceptional 40.8% |
| Palestinians | 95.8 /100 | #115 | Exceptional 40.7% |
| Immigrants | Uganda | 95.7 /100 | #116 | Exceptional 40.7% |
| Austrians | 95.5 /100 | #117 | Exceptional 40.6% |
| Croatians | 95.5 /100 | #118 | Exceptional 40.6% |
| Immigrants | Syria | 94.9 /100 | #119 | Exceptional 40.5% |
| Venezuelans | 94.7 /100 | #120 | Exceptional 40.5% |
| Moroccans | 94.6 /100 | #121 | Exceptional 40.5% |
| Immigrants | Albania | 94.4 /100 | #122 | Exceptional 40.4% |
| Lebanese | 94.3 /100 | #123 | Exceptional 40.4% |
Demographics Similar to Alaska Natives by Bachelor's Degree
In terms of bachelor's degree, the demographic groups most similar to Alaska Natives are Seminole (29.4%, a difference of 0.18%), Choctaw (29.4%, a difference of 0.24%), Shoshone (29.3%, a difference of 0.29%), Cheyenne (29.4%, a difference of 0.31%), and Immigrants from Cabo Verde (29.2%, a difference of 0.37%).
| Demographics | Rating | Rank | Bachelor's Degree |
| Immigrants | Yemen | 0.0 /100 | #306 | Tragic 29.9% |
| Nepalese | 0.0 /100 | #307 | Tragic 29.9% |
| Cajuns | 0.0 /100 | #308 | Tragic 29.6% |
| Hispanics or Latinos | 0.0 /100 | #309 | Tragic 29.6% |
| Cheyenne | 0.0 /100 | #310 | Tragic 29.4% |
| Choctaw | 0.0 /100 | #311 | Tragic 29.4% |
| Seminole | 0.0 /100 | #312 | Tragic 29.4% |
| Alaska Natives | 0.0 /100 | #313 | Tragic 29.4% |
| Shoshone | 0.0 /100 | #314 | Tragic 29.3% |
| Immigrants | Cabo Verde | 0.0 /100 | #315 | Tragic 29.2% |
| Sioux | 0.0 /100 | #316 | Tragic 29.1% |
| Colville | 0.0 /100 | #317 | Tragic 29.0% |
| Yaqui | 0.0 /100 | #318 | Tragic 29.0% |
| Creek | 0.0 /100 | #319 | Tragic 28.9% |
| Kiowa | 0.0 /100 | #320 | Tragic 28.8% |