Immigrants from Uganda vs Canadian Householder Income Ages 45 - 64 years
COMPARE
Immigrants from Uganda
Canadian
Householder Income Ages 45 - 64 years
Householder Income Ages 45 - 64 years Comparison
Immigrants from Uganda
Canadians
$103,584
HOUSEHOLDER INCOME AGES 45 - 64 YEARS
83.7/ 100
METRIC RATING
141st/ 347
METRIC RANK
$104,560
HOUSEHOLDER INCOME AGES 45 - 64 YEARS
89.3/ 100
METRIC RATING
134th/ 347
METRIC RANK
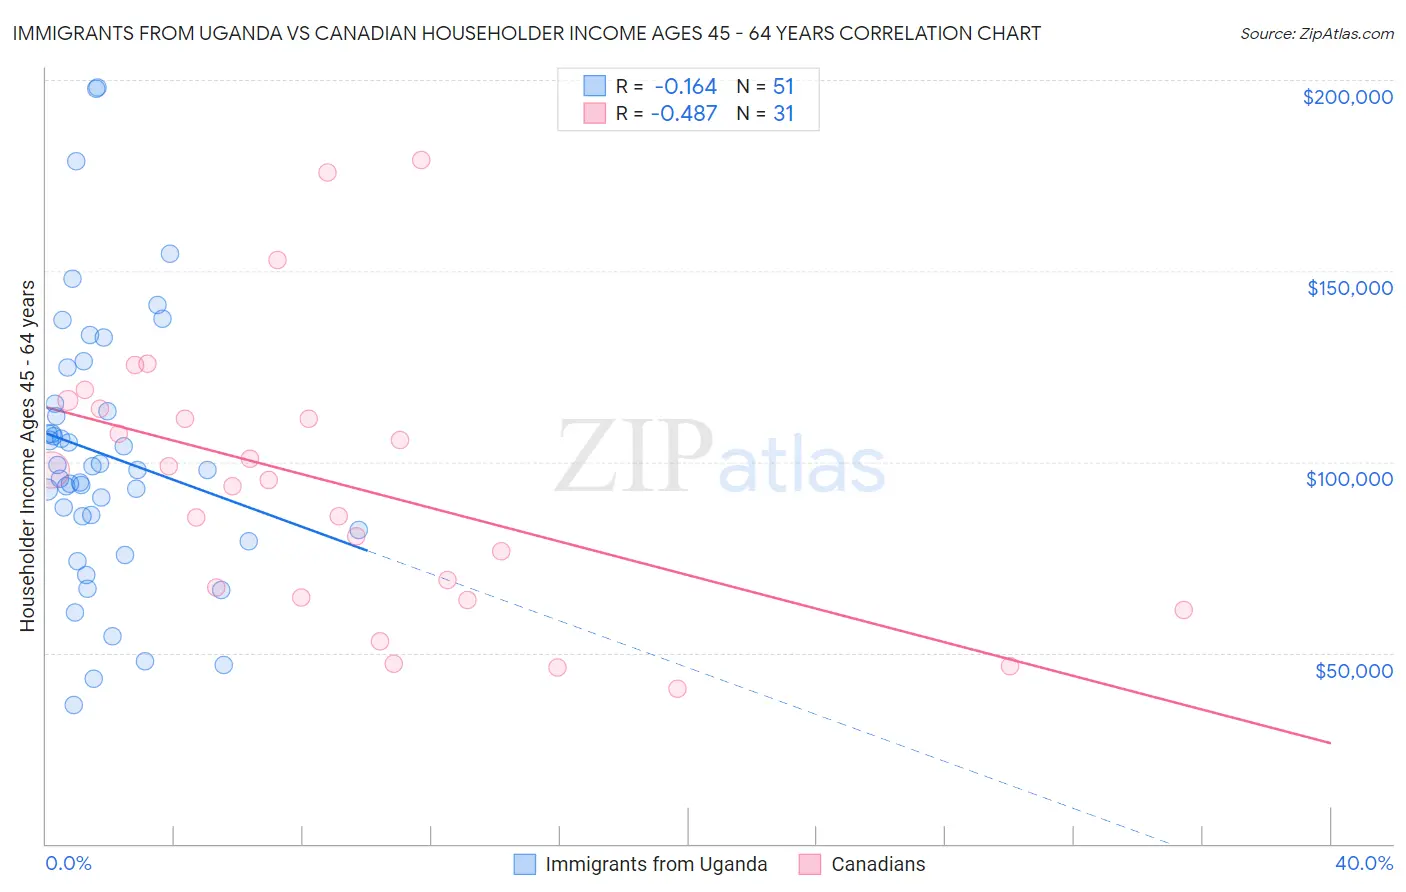
Immigrants from Uganda vs Canadian Householder Income Ages 45 - 64 years Correlation Chart
The statistical analysis conducted on geographies consisting of 125,945,072 people shows a poor negative correlation between the proportion of Immigrants from Uganda and household income with householder between the ages 45 and 64 in the United States with a correlation coefficient (R) of -0.164 and weighted average of $103,584. Similarly, the statistical analysis conducted on geographies consisting of 436,616,971 people shows a moderate negative correlation between the proportion of Canadians and household income with householder between the ages 45 and 64 in the United States with a correlation coefficient (R) of -0.487 and weighted average of $104,560, a difference of 0.94%.
Householder Income Ages 45 - 64 years Correlation Summary
| Measurement | Immigrants from Uganda | Canadian |
| Minimum | $36,234 | $40,750 |
| Maximum | $198,089 | $178,981 |
| Range | $161,856 | $138,231 |
| Mean | $101,898 | $94,099 |
| Median | $97,891 | $95,411 |
| Interquartile 25% (IQ1) | $82,188 | $64,375 |
| Interquartile 75% (IQ3) | $115,253 | $113,872 |
| Interquartile Range (IQR) | $33,065 | $49,497 |
| Standard Deviation (Sample) | $35,142 | $35,584 |
| Standard Deviation (Population) | $34,796 | $35,005 |
Demographics Similar to Immigrants from Uganda and Canadians by Householder Income Ages 45 - 64 years
In terms of householder income ages 45 - 64 years, the demographic groups most similar to Immigrants from Uganda are Luxembourger ($103,536, a difference of 0.050%), Serbian ($103,522, a difference of 0.060%), Czech ($103,507, a difference of 0.070%), Norwegian ($103,682, a difference of 0.090%), and Ugandan ($103,472, a difference of 0.11%). Similarly, the demographic groups most similar to Canadians are Arab ($104,566, a difference of 0.010%), Brazilian ($104,408, a difference of 0.15%), Lebanese ($104,734, a difference of 0.17%), Immigrants from Syria ($104,858, a difference of 0.29%), and Taiwanese ($104,180, a difference of 0.36%).
| Demographics | Rating | Rank | Householder Income Ages 45 - 64 years |
| Immigrants | Saudi Arabia | 92.2 /100 | #127 | Exceptional $105,249 |
| Native Hawaiians | 91.8 /100 | #128 | Exceptional $105,149 |
| Peruvians | 91.5 /100 | #129 | Exceptional $105,070 |
| Immigrants | Zimbabwe | 91.2 /100 | #130 | Exceptional $104,992 |
| Immigrants | Syria | 90.7 /100 | #131 | Exceptional $104,858 |
| Lebanese | 90.1 /100 | #132 | Exceptional $104,734 |
| Arabs | 89.3 /100 | #133 | Excellent $104,566 |
| Canadians | 89.3 /100 | #134 | Excellent $104,560 |
| Brazilians | 88.6 /100 | #135 | Excellent $104,408 |
| Taiwanese | 87.4 /100 | #136 | Excellent $104,180 |
| Hungarians | 85.8 /100 | #137 | Excellent $103,913 |
| Ethiopians | 84.7 /100 | #138 | Excellent $103,736 |
| Immigrants | Oceania | 84.5 /100 | #139 | Excellent $103,705 |
| Norwegians | 84.3 /100 | #140 | Excellent $103,682 |
| Immigrants | Uganda | 83.7 /100 | #141 | Excellent $103,584 |
| Luxembourgers | 83.3 /100 | #142 | Excellent $103,536 |
| Serbians | 83.2 /100 | #143 | Excellent $103,522 |
| Czechs | 83.1 /100 | #144 | Excellent $103,507 |
| Ugandans | 82.9 /100 | #145 | Excellent $103,472 |
| Immigrants | Chile | 82.5 /100 | #146 | Excellent $103,412 |
| Basques | 82.3 /100 | #147 | Excellent $103,387 |