Immigrants from Turkey vs Jamaican Female Unemployment
COMPARE
Immigrants from Turkey
Jamaican
Female Unemployment
Female Unemployment Comparison
Immigrants from Turkey
Jamaicans
5.1%
FEMALE UNEMPLOYMENT
91.0/ 100
METRIC RATING
114th/ 347
METRIC RANK
6.1%
FEMALE UNEMPLOYMENT
0.0/ 100
METRIC RATING
298th/ 347
METRIC RANK
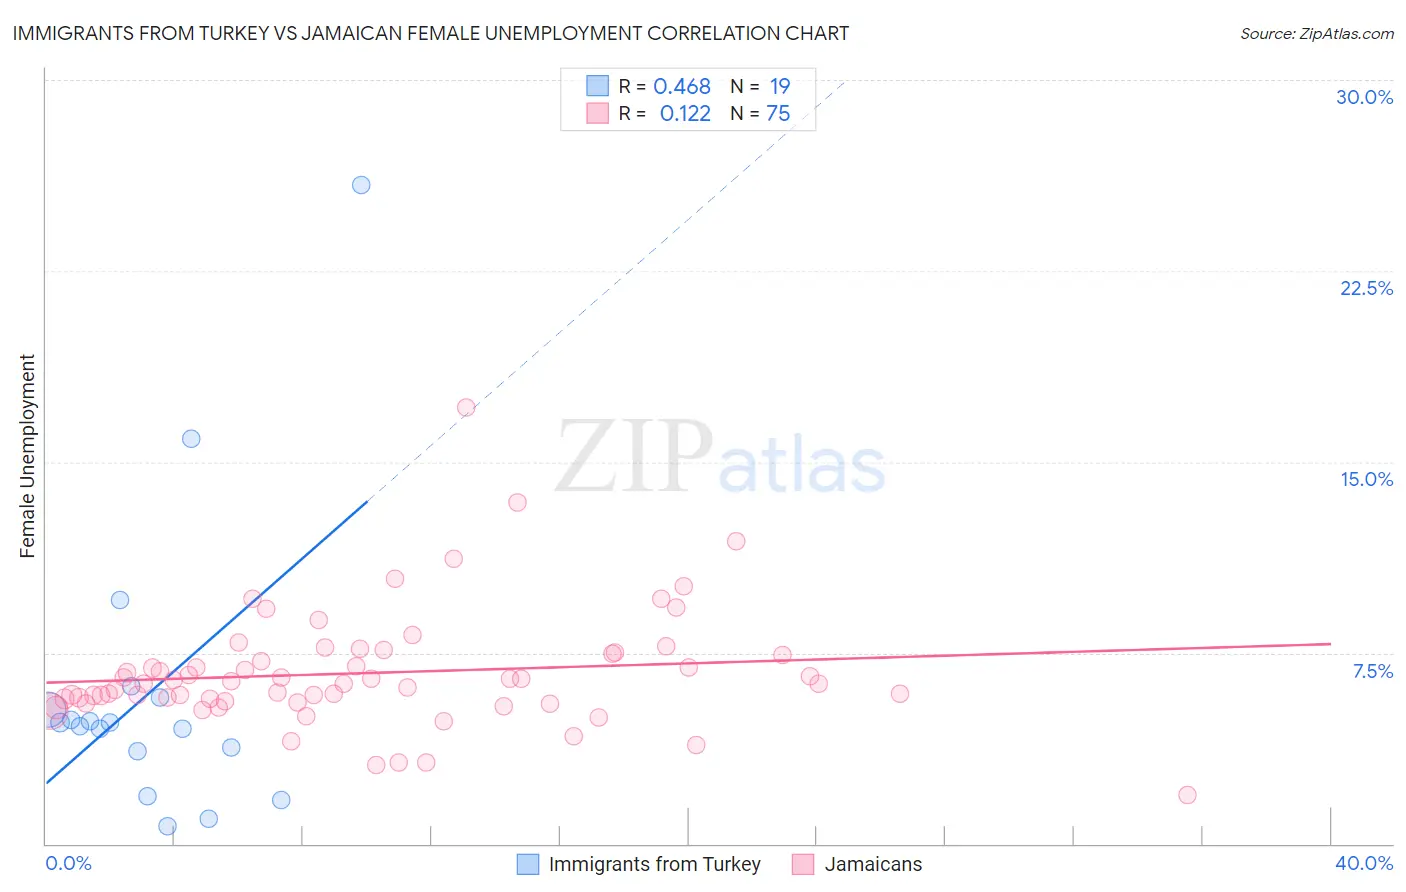
Immigrants from Turkey vs Jamaican Female Unemployment Correlation Chart
The statistical analysis conducted on geographies consisting of 222,692,484 people shows a moderate positive correlation between the proportion of Immigrants from Turkey and unemploymnet rate among females in the United States with a correlation coefficient (R) of 0.468 and weighted average of 5.1%. Similarly, the statistical analysis conducted on geographies consisting of 366,799,566 people shows a poor positive correlation between the proportion of Jamaicans and unemploymnet rate among females in the United States with a correlation coefficient (R) of 0.122 and weighted average of 6.1%, a difference of 20.7%.
Female Unemployment Correlation Summary
| Measurement | Immigrants from Turkey | Jamaican |
| Minimum | 0.70% | 1.9% |
| Maximum | 25.9% | 17.2% |
| Range | 25.2% | 15.3% |
| Mean | 6.0% | 6.7% |
| Median | 4.8% | 6.3% |
| Interquartile 25% (IQ1) | 3.6% | 5.6% |
| Interquartile 75% (IQ3) | 5.7% | 7.5% |
| Interquartile Range (IQR) | 2.1% | 1.9% |
| Standard Deviation (Sample) | 5.9% | 2.3% |
| Standard Deviation (Population) | 5.7% | 2.3% |
Similar Demographics by Female Unemployment
Demographics Similar to Immigrants from Turkey by Female Unemployment
In terms of female unemployment, the demographic groups most similar to Immigrants from Turkey are Lebanese (5.1%, a difference of 0.020%), Immigrants from Saudi Arabia (5.1%, a difference of 0.040%), American (5.1%, a difference of 0.10%), Jordanian (5.1%, a difference of 0.14%), and Immigrants from Croatia (5.1%, a difference of 0.20%).
| Demographics | Rating | Rank | Female Unemployment |
| Immigrants | Switzerland | 93.1 /100 | #107 | Exceptional 5.1% |
| Puget Sound Salish | 93.0 /100 | #108 | Exceptional 5.1% |
| Immigrants | Eastern Africa | 92.8 /100 | #109 | Exceptional 5.1% |
| Macedonians | 92.4 /100 | #110 | Exceptional 5.1% |
| Immigrants | Burma/Myanmar | 92.3 /100 | #111 | Exceptional 5.1% |
| Estonians | 92.1 /100 | #112 | Exceptional 5.1% |
| Immigrants | Saudi Arabia | 91.2 /100 | #113 | Exceptional 5.1% |
| Immigrants | Turkey | 91.0 /100 | #114 | Exceptional 5.1% |
| Lebanese | 91.0 /100 | #115 | Exceptional 5.1% |
| Americans | 90.5 /100 | #116 | Exceptional 5.1% |
| Jordanians | 90.3 /100 | #117 | Exceptional 5.1% |
| Immigrants | Croatia | 89.9 /100 | #118 | Excellent 5.1% |
| Immigrants | North Macedonia | 88.3 /100 | #119 | Excellent 5.1% |
| Immigrants | Romania | 88.1 /100 | #120 | Excellent 5.1% |
| Immigrants | Western Europe | 88.1 /100 | #121 | Excellent 5.1% |
Demographics Similar to Jamaicans by Female Unemployment
In terms of female unemployment, the demographic groups most similar to Jamaicans are West Indian (6.1%, a difference of 0.020%), Alaskan Athabascan (6.1%, a difference of 0.030%), Immigrants from Latin America (6.1%, a difference of 0.050%), Ute (6.1%, a difference of 0.10%), and Immigrants from Haiti (6.1%, a difference of 0.15%).
| Demographics | Rating | Rank | Female Unemployment |
| Immigrants | West Indies | 0.0 /100 | #291 | Tragic 6.1% |
| Immigrants | Trinidad and Tobago | 0.0 /100 | #292 | Tragic 6.1% |
| Mexicans | 0.0 /100 | #293 | Tragic 6.1% |
| Immigrants | El Salvador | 0.0 /100 | #294 | Tragic 6.1% |
| Immigrants | Latin America | 0.0 /100 | #295 | Tragic 6.1% |
| Alaskan Athabascans | 0.0 /100 | #296 | Tragic 6.1% |
| West Indians | 0.0 /100 | #297 | Tragic 6.1% |
| Jamaicans | 0.0 /100 | #298 | Tragic 6.1% |
| Ute | 0.0 /100 | #299 | Tragic 6.1% |
| Immigrants | Haiti | 0.0 /100 | #300 | Tragic 6.1% |
| Immigrants | Barbados | 0.0 /100 | #301 | Tragic 6.2% |
| U.S. Virgin Islanders | 0.0 /100 | #302 | Tragic 6.2% |
| Barbadians | 0.0 /100 | #303 | Tragic 6.2% |
| Immigrants | Jamaica | 0.0 /100 | #304 | Tragic 6.2% |
| Spanish American Indians | 0.0 /100 | #305 | Tragic 6.2% |