Immigrants from Turkey vs Immigrants from Belarus Master's Degree
COMPARE
Immigrants from Turkey
Immigrants from Belarus
Master's Degree
Master's Degree Comparison
Immigrants from Turkey
Immigrants from Belarus
19.7%
MASTER'S DEGREE
100.0/ 100
METRIC RATING
30th/ 347
METRIC RANK
18.9%
MASTER'S DEGREE
100.0/ 100
METRIC RATING
45th/ 347
METRIC RANK
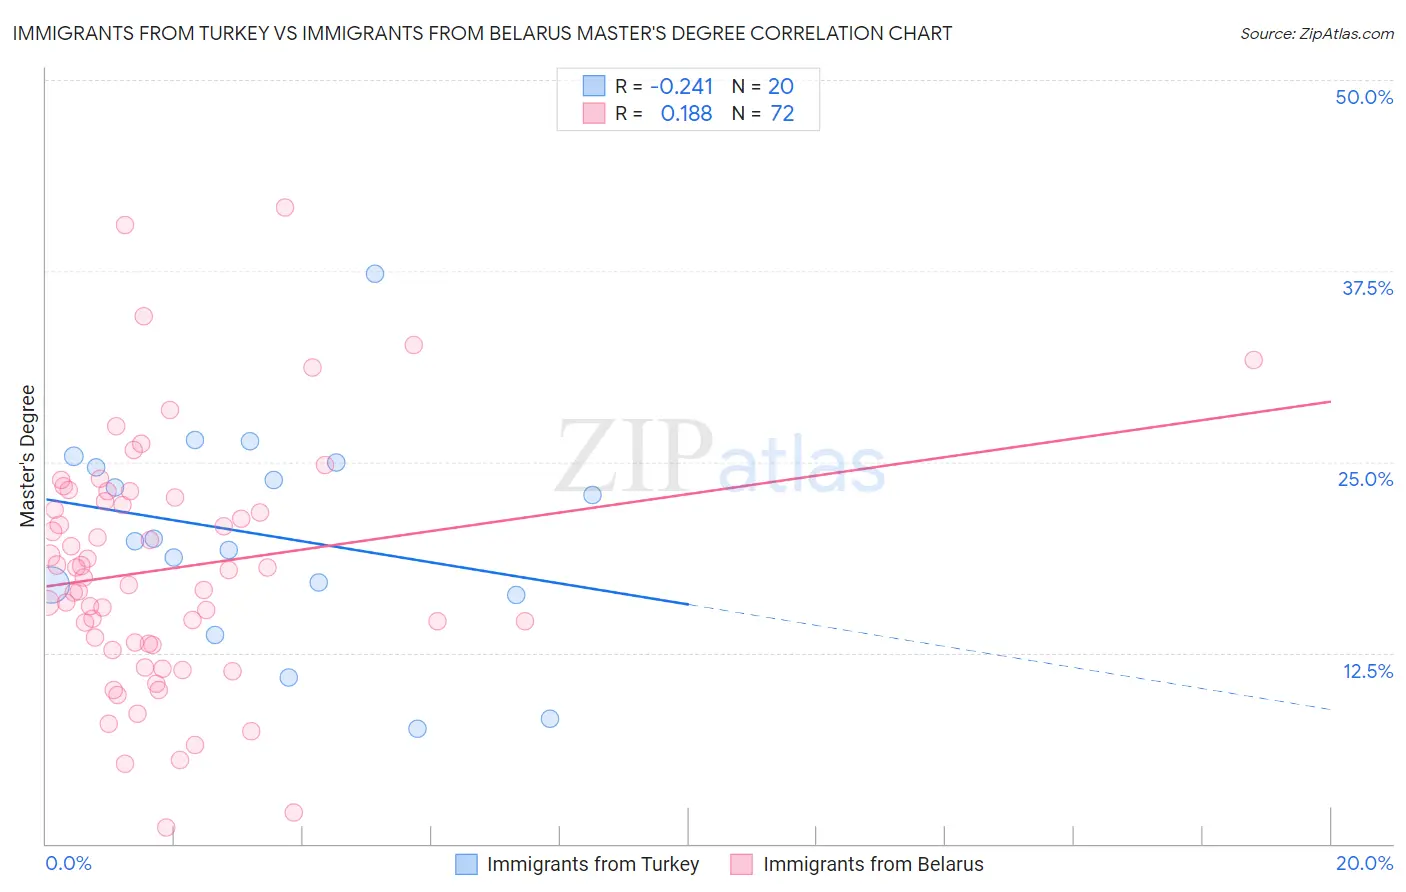
Immigrants from Turkey vs Immigrants from Belarus Master's Degree Correlation Chart
The statistical analysis conducted on geographies consisting of 223,018,840 people shows a weak negative correlation between the proportion of Immigrants from Turkey and percentage of population with at least master's degree education in the United States with a correlation coefficient (R) of -0.241 and weighted average of 19.7%. Similarly, the statistical analysis conducted on geographies consisting of 150,177,035 people shows a poor positive correlation between the proportion of Immigrants from Belarus and percentage of population with at least master's degree education in the United States with a correlation coefficient (R) of 0.188 and weighted average of 18.9%, a difference of 4.3%.
Master's Degree Correlation Summary
| Measurement | Immigrants from Turkey | Immigrants from Belarus |
| Minimum | 7.6% | 1.1% |
| Maximum | 37.3% | 41.7% |
| Range | 29.8% | 40.6% |
| Mean | 20.2% | 18.0% |
| Median | 19.9% | 17.7% |
| Interquartile 25% (IQ1) | 16.6% | 13.0% |
| Interquartile 75% (IQ3) | 24.8% | 22.5% |
| Interquartile Range (IQR) | 8.2% | 9.5% |
| Standard Deviation (Sample) | 7.0% | 8.0% |
| Standard Deviation (Population) | 6.9% | 7.9% |
Demographics Similar to Immigrants from Turkey and Immigrants from Belarus by Master's Degree
In terms of master's degree, the demographic groups most similar to Immigrants from Turkey are Immigrants from Korea (19.7%, a difference of 0.010%), Burmese (19.7%, a difference of 0.080%), Latvian (19.8%, a difference of 0.50%), Russian (19.5%, a difference of 0.86%), and Immigrants from Denmark (19.5%, a difference of 0.89%). Similarly, the demographic groups most similar to Immigrants from Belarus are Immigrants from Malaysia (18.9%, a difference of 0.11%), Immigrants from Norway (18.8%, a difference of 0.38%), Immigrants from Greece (19.0%, a difference of 0.39%), Immigrants from Saudi Arabia (19.0%, a difference of 0.40%), and Immigrants from Austria (18.8%, a difference of 0.40%).
| Demographics | Rating | Rank | Master's Degree |
| Immigrants | Sri Lanka | 100.0 /100 | #27 | Exceptional 19.9% |
| Turks | 100.0 /100 | #28 | Exceptional 19.9% |
| Latvians | 100.0 /100 | #29 | Exceptional 19.8% |
| Immigrants | Turkey | 100.0 /100 | #30 | Exceptional 19.7% |
| Immigrants | Korea | 100.0 /100 | #31 | Exceptional 19.7% |
| Burmese | 100.0 /100 | #32 | Exceptional 19.7% |
| Russians | 100.0 /100 | #33 | Exceptional 19.5% |
| Immigrants | Denmark | 100.0 /100 | #34 | Exceptional 19.5% |
| Immigrants | Northern Europe | 100.0 /100 | #35 | Exceptional 19.5% |
| Immigrants | Russia | 100.0 /100 | #36 | Exceptional 19.4% |
| Mongolians | 100.0 /100 | #37 | Exceptional 19.4% |
| Bolivians | 100.0 /100 | #38 | Exceptional 19.3% |
| Immigrants | Spain | 100.0 /100 | #39 | Exceptional 19.1% |
| Immigrants | Bolivia | 100.0 /100 | #40 | Exceptional 19.1% |
| Immigrants | Latvia | 100.0 /100 | #41 | Exceptional 19.1% |
| Immigrants | Saudi Arabia | 100.0 /100 | #42 | Exceptional 19.0% |
| Immigrants | Greece | 100.0 /100 | #43 | Exceptional 19.0% |
| Immigrants | Malaysia | 100.0 /100 | #44 | Exceptional 18.9% |
| Immigrants | Belarus | 100.0 /100 | #45 | Exceptional 18.9% |
| Immigrants | Norway | 100.0 /100 | #46 | Exceptional 18.8% |
| Immigrants | Austria | 100.0 /100 | #47 | Exceptional 18.8% |