Immigrants from Turkey vs Hispanic or Latino Master's Degree
COMPARE
Immigrants from Turkey
Hispanic or Latino
Master's Degree
Master's Degree Comparison
Immigrants from Turkey
Hispanics or Latinos
19.7%
MASTER'S DEGREE
100.0/ 100
METRIC RATING
30th/ 347
METRIC RANK
10.9%
MASTER'S DEGREE
0.0/ 100
METRIC RATING
316th/ 347
METRIC RANK
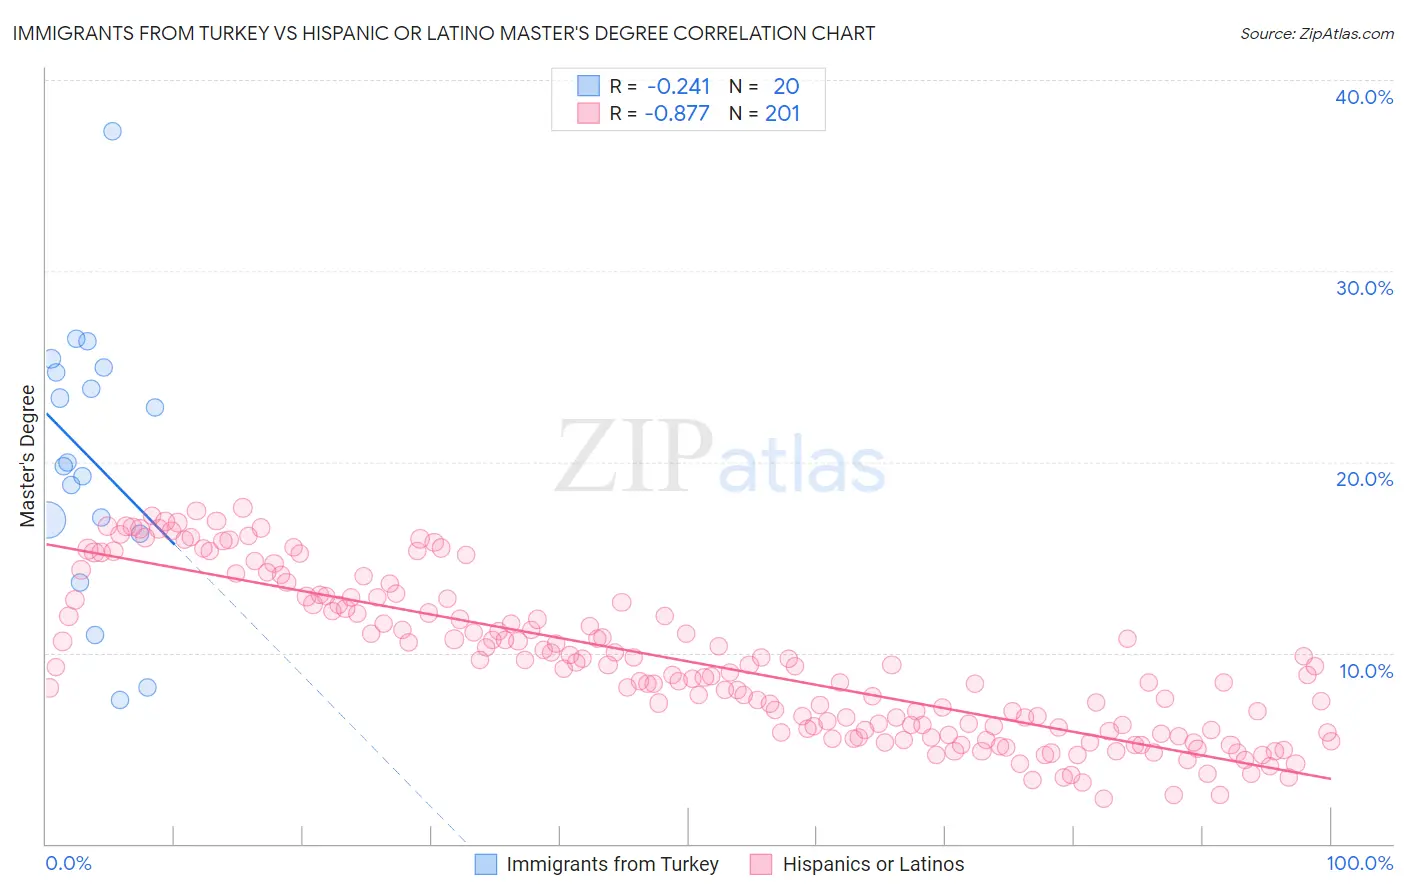
Immigrants from Turkey vs Hispanic or Latino Master's Degree Correlation Chart
The statistical analysis conducted on geographies consisting of 223,018,840 people shows a weak negative correlation between the proportion of Immigrants from Turkey and percentage of population with at least master's degree education in the United States with a correlation coefficient (R) of -0.241 and weighted average of 19.7%. Similarly, the statistical analysis conducted on geographies consisting of 577,228,232 people shows a very strong negative correlation between the proportion of Hispanics or Latinos and percentage of population with at least master's degree education in the United States with a correlation coefficient (R) of -0.877 and weighted average of 10.9%, a difference of 80.4%.
Master's Degree Correlation Summary
| Measurement | Immigrants from Turkey | Hispanic or Latino |
| Minimum | 7.6% | 2.4% |
| Maximum | 37.3% | 17.6% |
| Range | 29.8% | 15.2% |
| Mean | 20.2% | 9.5% |
| Median | 19.9% | 9.2% |
| Interquartile 25% (IQ1) | 16.6% | 5.9% |
| Interquartile 75% (IQ3) | 24.8% | 12.7% |
| Interquartile Range (IQR) | 8.2% | 6.8% |
| Standard Deviation (Sample) | 7.0% | 4.1% |
| Standard Deviation (Population) | 6.9% | 4.1% |
Similar Demographics by Master's Degree
Demographics Similar to Immigrants from Turkey by Master's Degree
In terms of master's degree, the demographic groups most similar to Immigrants from Turkey are Immigrants from Korea (19.7%, a difference of 0.010%), Burmese (19.7%, a difference of 0.080%), Latvian (19.8%, a difference of 0.50%), Russian (19.5%, a difference of 0.86%), and Immigrants from Denmark (19.5%, a difference of 0.89%).
| Demographics | Rating | Rank | Master's Degree |
| Immigrants | France | 100.0 /100 | #23 | Exceptional 20.3% |
| Immigrants | Sweden | 100.0 /100 | #24 | Exceptional 20.3% |
| Immigrants | Japan | 100.0 /100 | #25 | Exceptional 20.0% |
| Cambodians | 100.0 /100 | #26 | Exceptional 20.0% |
| Immigrants | Sri Lanka | 100.0 /100 | #27 | Exceptional 19.9% |
| Turks | 100.0 /100 | #28 | Exceptional 19.9% |
| Latvians | 100.0 /100 | #29 | Exceptional 19.8% |
| Immigrants | Turkey | 100.0 /100 | #30 | Exceptional 19.7% |
| Immigrants | Korea | 100.0 /100 | #31 | Exceptional 19.7% |
| Burmese | 100.0 /100 | #32 | Exceptional 19.7% |
| Russians | 100.0 /100 | #33 | Exceptional 19.5% |
| Immigrants | Denmark | 100.0 /100 | #34 | Exceptional 19.5% |
| Immigrants | Northern Europe | 100.0 /100 | #35 | Exceptional 19.5% |
| Immigrants | Russia | 100.0 /100 | #36 | Exceptional 19.4% |
| Mongolians | 100.0 /100 | #37 | Exceptional 19.4% |
Demographics Similar to Hispanics or Latinos by Master's Degree
In terms of master's degree, the demographic groups most similar to Hispanics or Latinos are Apache (11.0%, a difference of 0.34%), Cajun (11.0%, a difference of 0.35%), Hopi (10.9%, a difference of 0.54%), Immigrants from Cuba (10.9%, a difference of 0.67%), and Yaqui (11.0%, a difference of 0.74%).
| Demographics | Rating | Rank | Master's Degree |
| Puget Sound Salish | 0.0 /100 | #309 | Tragic 11.1% |
| Shoshone | 0.0 /100 | #310 | Tragic 11.1% |
| Seminole | 0.0 /100 | #311 | Tragic 11.0% |
| Choctaw | 0.0 /100 | #312 | Tragic 11.0% |
| Yaqui | 0.0 /100 | #313 | Tragic 11.0% |
| Cajuns | 0.0 /100 | #314 | Tragic 11.0% |
| Apache | 0.0 /100 | #315 | Tragic 11.0% |
| Hispanics or Latinos | 0.0 /100 | #316 | Tragic 10.9% |
| Hopi | 0.0 /100 | #317 | Tragic 10.9% |
| Immigrants | Cuba | 0.0 /100 | #318 | Tragic 10.9% |
| Kiowa | 0.0 /100 | #319 | Tragic 10.8% |
| Immigrants | Micronesia | 0.0 /100 | #320 | Tragic 10.8% |
| Pennsylvania Germans | 0.0 /100 | #321 | Tragic 10.7% |
| Sioux | 0.0 /100 | #322 | Tragic 10.7% |
| Crow | 0.0 /100 | #323 | Tragic 10.6% |