Immigrants from Turkey vs Immigrants from Iran College, 1 year or more
COMPARE
Immigrants from Turkey
Immigrants from Iran
College, 1 year or more
College, 1 year or more Comparison
Immigrants from Turkey
Immigrants from Iran
65.2%
COLLEGE, 1 YEAR OR MORE
99.9/ 100
METRIC RATING
35th/ 347
METRIC RANK
69.5%
COLLEGE, 1 YEAR OR MORE
100.0/ 100
METRIC RATING
6th/ 347
METRIC RANK
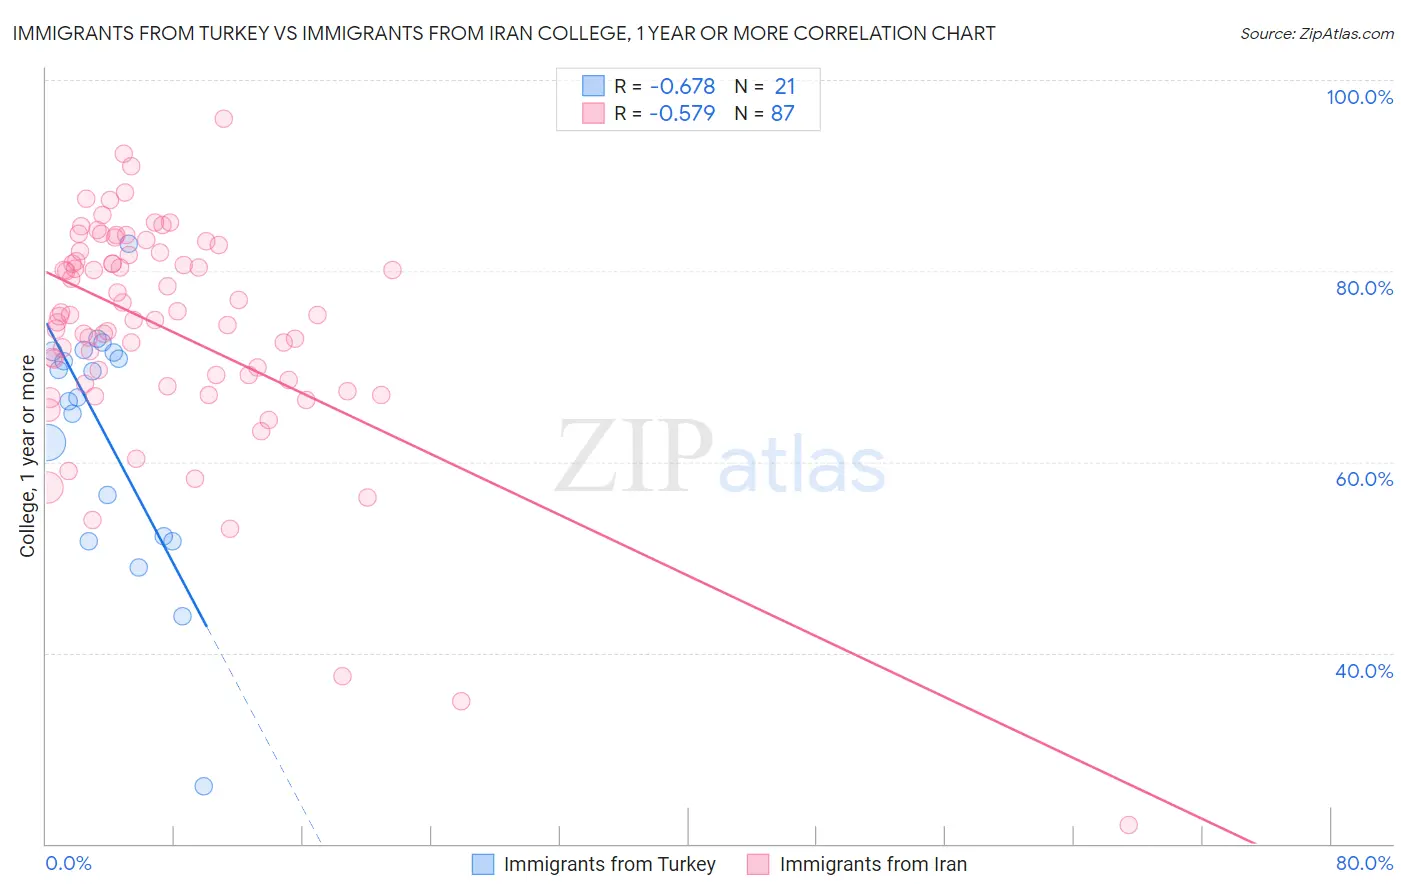
Immigrants from Turkey vs Immigrants from Iran College, 1 year or more Correlation Chart
The statistical analysis conducted on geographies consisting of 223,057,840 people shows a significant negative correlation between the proportion of Immigrants from Turkey and percentage of population with at least college, 1 year or more education in the United States with a correlation coefficient (R) of -0.678 and weighted average of 65.2%. Similarly, the statistical analysis conducted on geographies consisting of 279,905,207 people shows a substantial negative correlation between the proportion of Immigrants from Iran and percentage of population with at least college, 1 year or more education in the United States with a correlation coefficient (R) of -0.579 and weighted average of 69.5%, a difference of 6.6%.
College, 1 year or more Correlation Summary
| Measurement | Immigrants from Turkey | Immigrants from Iran |
| Minimum | 26.0% | 22.0% |
| Maximum | 82.8% | 96.0% |
| Range | 56.8% | 74.0% |
| Mean | 62.6% | 74.0% |
| Median | 66.8% | 75.3% |
| Interquartile 25% (IQ1) | 52.0% | 68.5% |
| Interquartile 75% (IQ3) | 71.5% | 82.0% |
| Interquartile Range (IQR) | 19.5% | 13.4% |
| Standard Deviation (Sample) | 13.0% | 12.0% |
| Standard Deviation (Population) | 12.7% | 11.9% |
Similar Demographics by College, 1 year or more
Demographics Similar to Immigrants from Turkey by College, 1 year or more
In terms of college, 1 year or more, the demographic groups most similar to Immigrants from Turkey are Immigrants from South Africa (65.1%, a difference of 0.080%), Russian (65.1%, a difference of 0.090%), Israeli (65.3%, a difference of 0.20%), Immigrants from Saudi Arabia (65.0%, a difference of 0.24%), and Estonian (65.0%, a difference of 0.31%).
| Demographics | Rating | Rank | College, 1 year or more |
| Immigrants | France | 100.0 /100 | #28 | Exceptional 65.8% |
| Immigrants | Northern Europe | 100.0 /100 | #29 | Exceptional 65.6% |
| Immigrants | Denmark | 100.0 /100 | #30 | Exceptional 65.6% |
| Turks | 100.0 /100 | #31 | Exceptional 65.5% |
| Bulgarians | 100.0 /100 | #32 | Exceptional 65.5% |
| Immigrants | Sri Lanka | 99.9 /100 | #33 | Exceptional 65.4% |
| Israelis | 99.9 /100 | #34 | Exceptional 65.3% |
| Immigrants | Turkey | 99.9 /100 | #35 | Exceptional 65.2% |
| Immigrants | South Africa | 99.9 /100 | #36 | Exceptional 65.1% |
| Russians | 99.9 /100 | #37 | Exceptional 65.1% |
| Immigrants | Saudi Arabia | 99.9 /100 | #38 | Exceptional 65.0% |
| Estonians | 99.9 /100 | #39 | Exceptional 65.0% |
| Immigrants | Kuwait | 99.9 /100 | #40 | Exceptional 65.0% |
| Mongolians | 99.9 /100 | #41 | Exceptional 64.8% |
| Immigrants | Latvia | 99.9 /100 | #42 | Exceptional 64.8% |
Demographics Similar to Immigrants from Iran by College, 1 year or more
In terms of college, 1 year or more, the demographic groups most similar to Immigrants from Iran are Immigrants from Taiwan (69.6%, a difference of 0.20%), Immigrants from India (69.6%, a difference of 0.20%), Iranian (70.0%, a difference of 0.70%), Okinawan (69.0%, a difference of 0.77%), and Immigrants from Singapore (70.1%, a difference of 0.92%).
| Demographics | Rating | Rank | College, 1 year or more |
| Filipinos | 100.0 /100 | #1 | Exceptional 71.0% |
| Immigrants | Singapore | 100.0 /100 | #2 | Exceptional 70.1% |
| Iranians | 100.0 /100 | #3 | Exceptional 70.0% |
| Immigrants | Taiwan | 100.0 /100 | #4 | Exceptional 69.6% |
| Immigrants | India | 100.0 /100 | #5 | Exceptional 69.6% |
| Immigrants | Iran | 100.0 /100 | #6 | Exceptional 69.5% |
| Okinawans | 100.0 /100 | #7 | Exceptional 69.0% |
| Thais | 100.0 /100 | #8 | Exceptional 68.6% |
| Immigrants | Israel | 100.0 /100 | #9 | Exceptional 67.8% |
| Immigrants | Australia | 100.0 /100 | #10 | Exceptional 67.7% |
| Immigrants | South Central Asia | 100.0 /100 | #11 | Exceptional 67.1% |
| Cypriots | 100.0 /100 | #12 | Exceptional 67.0% |
| Immigrants | Sweden | 100.0 /100 | #13 | Exceptional 66.8% |
| Burmese | 100.0 /100 | #14 | Exceptional 66.7% |
| Cambodians | 100.0 /100 | #15 | Exceptional 66.7% |