Immigrants from Portugal vs Immigrants from Iran College, 1 year or more
COMPARE
Immigrants from Portugal
Immigrants from Iran
College, 1 year or more
College, 1 year or more Comparison
Immigrants from Portugal
Immigrants from Iran
51.9%
COLLEGE, 1 YEAR OR MORE
0.0/ 100
METRIC RATING
307th/ 347
METRIC RANK
69.5%
COLLEGE, 1 YEAR OR MORE
100.0/ 100
METRIC RATING
6th/ 347
METRIC RANK
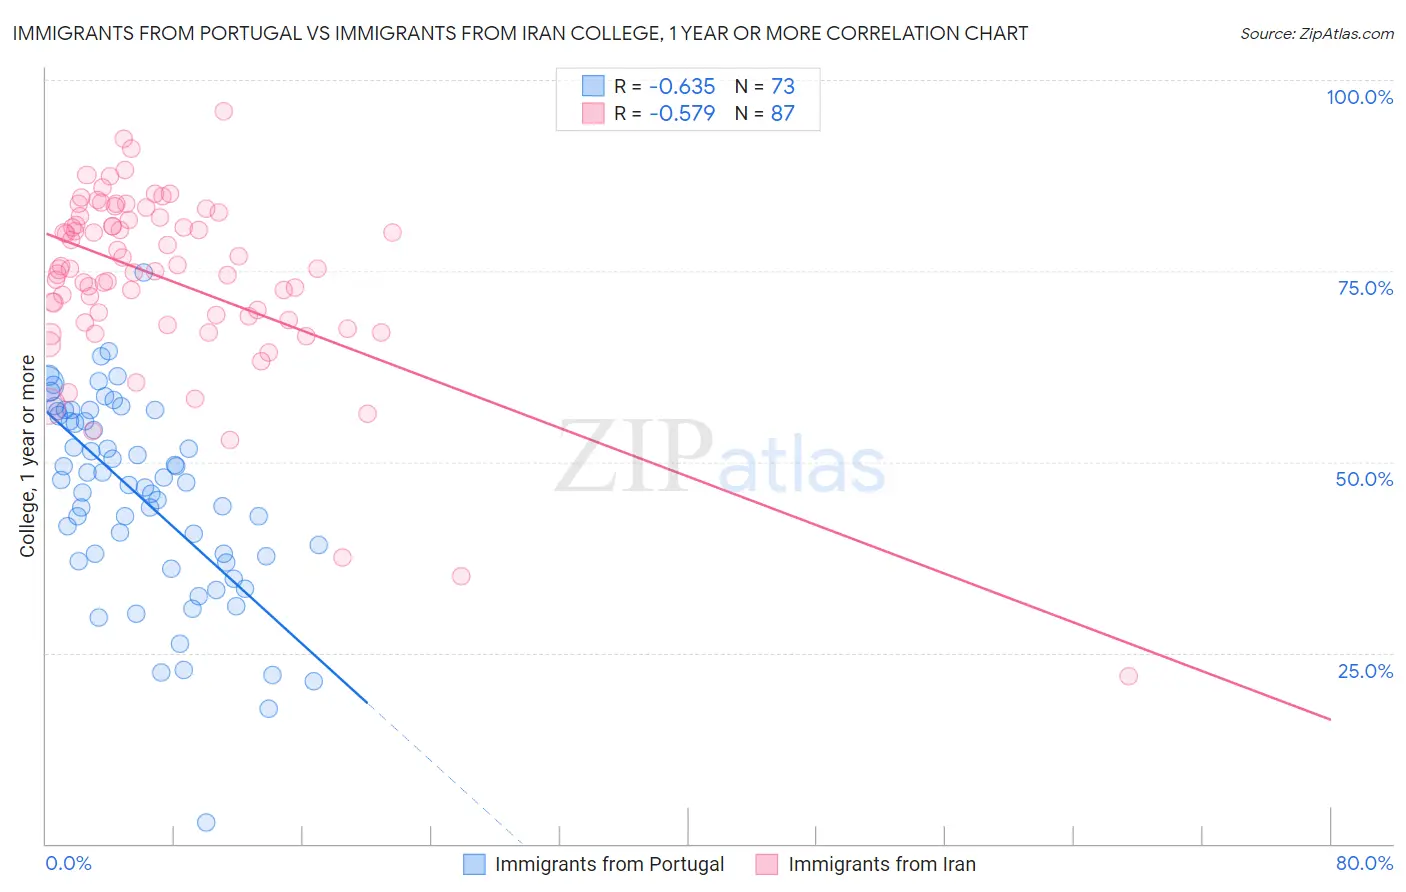
Immigrants from Portugal vs Immigrants from Iran College, 1 year or more Correlation Chart
The statistical analysis conducted on geographies consisting of 174,792,609 people shows a significant negative correlation between the proportion of Immigrants from Portugal and percentage of population with at least college, 1 year or more education in the United States with a correlation coefficient (R) of -0.635 and weighted average of 51.9%. Similarly, the statistical analysis conducted on geographies consisting of 279,905,207 people shows a substantial negative correlation between the proportion of Immigrants from Iran and percentage of population with at least college, 1 year or more education in the United States with a correlation coefficient (R) of -0.579 and weighted average of 69.5%, a difference of 34.0%.
College, 1 year or more Correlation Summary
| Measurement | Immigrants from Portugal | Immigrants from Iran |
| Minimum | 2.8% | 22.0% |
| Maximum | 74.9% | 96.0% |
| Range | 72.1% | 74.0% |
| Mean | 45.5% | 74.0% |
| Median | 47.3% | 75.3% |
| Interquartile 25% (IQ1) | 37.3% | 68.5% |
| Interquartile 75% (IQ3) | 56.3% | 82.0% |
| Interquartile Range (IQR) | 19.0% | 13.4% |
| Standard Deviation (Sample) | 13.0% | 12.0% |
| Standard Deviation (Population) | 12.9% | 11.9% |
Similar Demographics by College, 1 year or more
Demographics Similar to Immigrants from Portugal by College, 1 year or more
In terms of college, 1 year or more, the demographic groups most similar to Immigrants from Portugal are Mexican American Indian (51.9%, a difference of 0.10%), Salvadoran (51.8%, a difference of 0.10%), Apache (51.8%, a difference of 0.11%), Seminole (52.1%, a difference of 0.44%), and Honduran (51.6%, a difference of 0.50%).
| Demographics | Rating | Rank | College, 1 year or more |
| Choctaw | 0.0 /100 | #300 | Tragic 52.3% |
| Haitians | 0.0 /100 | #301 | Tragic 52.3% |
| Puerto Ricans | 0.0 /100 | #302 | Tragic 52.2% |
| Creek | 0.0 /100 | #303 | Tragic 52.2% |
| Central Americans | 0.0 /100 | #304 | Tragic 52.1% |
| Seminole | 0.0 /100 | #305 | Tragic 52.1% |
| Mexican American Indians | 0.0 /100 | #306 | Tragic 51.9% |
| Immigrants | Portugal | 0.0 /100 | #307 | Tragic 51.9% |
| Salvadorans | 0.0 /100 | #308 | Tragic 51.8% |
| Apache | 0.0 /100 | #309 | Tragic 51.8% |
| Hondurans | 0.0 /100 | #310 | Tragic 51.6% |
| Immigrants | Haiti | 0.0 /100 | #311 | Tragic 51.5% |
| Pueblo | 0.0 /100 | #312 | Tragic 51.5% |
| Immigrants | Caribbean | 0.0 /100 | #313 | Tragic 51.4% |
| Fijians | 0.0 /100 | #314 | Tragic 51.3% |
Demographics Similar to Immigrants from Iran by College, 1 year or more
In terms of college, 1 year or more, the demographic groups most similar to Immigrants from Iran are Immigrants from Taiwan (69.6%, a difference of 0.20%), Immigrants from India (69.6%, a difference of 0.20%), Iranian (70.0%, a difference of 0.70%), Okinawan (69.0%, a difference of 0.77%), and Immigrants from Singapore (70.1%, a difference of 0.92%).
| Demographics | Rating | Rank | College, 1 year or more |
| Filipinos | 100.0 /100 | #1 | Exceptional 71.0% |
| Immigrants | Singapore | 100.0 /100 | #2 | Exceptional 70.1% |
| Iranians | 100.0 /100 | #3 | Exceptional 70.0% |
| Immigrants | Taiwan | 100.0 /100 | #4 | Exceptional 69.6% |
| Immigrants | India | 100.0 /100 | #5 | Exceptional 69.6% |
| Immigrants | Iran | 100.0 /100 | #6 | Exceptional 69.5% |
| Okinawans | 100.0 /100 | #7 | Exceptional 69.0% |
| Thais | 100.0 /100 | #8 | Exceptional 68.6% |
| Immigrants | Israel | 100.0 /100 | #9 | Exceptional 67.8% |
| Immigrants | Australia | 100.0 /100 | #10 | Exceptional 67.7% |
| Immigrants | South Central Asia | 100.0 /100 | #11 | Exceptional 67.1% |
| Cypriots | 100.0 /100 | #12 | Exceptional 67.0% |
| Immigrants | Sweden | 100.0 /100 | #13 | Exceptional 66.8% |
| Burmese | 100.0 /100 | #14 | Exceptional 66.7% |
| Cambodians | 100.0 /100 | #15 | Exceptional 66.7% |