Immigrants from Turkey vs Immigrants from Yemen College, 1 year or more
COMPARE
Immigrants from Turkey
Immigrants from Yemen
College, 1 year or more
College, 1 year or more Comparison
Immigrants from Turkey
Immigrants from Yemen
65.2%
COLLEGE, 1 YEAR OR MORE
99.9/ 100
METRIC RATING
35th/ 347
METRIC RANK
50.0%
COLLEGE, 1 YEAR OR MORE
0.0/ 100
METRIC RATING
331st/ 347
METRIC RANK
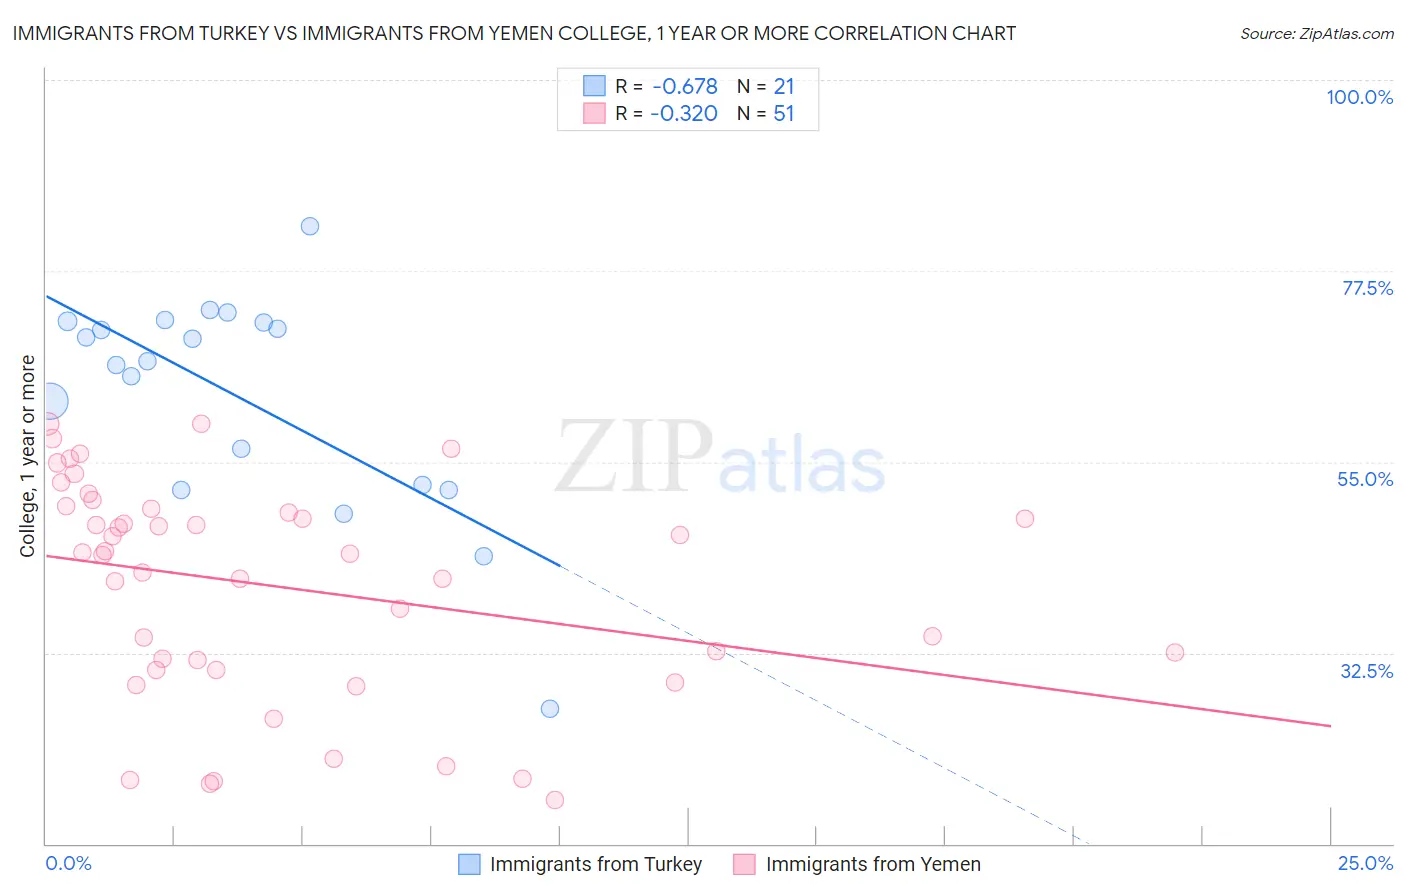
Immigrants from Turkey vs Immigrants from Yemen College, 1 year or more Correlation Chart
The statistical analysis conducted on geographies consisting of 223,057,840 people shows a significant negative correlation between the proportion of Immigrants from Turkey and percentage of population with at least college, 1 year or more education in the United States with a correlation coefficient (R) of -0.678 and weighted average of 65.2%. Similarly, the statistical analysis conducted on geographies consisting of 82,433,611 people shows a mild negative correlation between the proportion of Immigrants from Yemen and percentage of population with at least college, 1 year or more education in the United States with a correlation coefficient (R) of -0.320 and weighted average of 50.0%, a difference of 30.3%.
College, 1 year or more Correlation Summary
| Measurement | Immigrants from Turkey | Immigrants from Yemen |
| Minimum | 26.0% | 15.2% |
| Maximum | 82.8% | 59.5% |
| Range | 56.8% | 44.4% |
| Mean | 62.6% | 40.3% |
| Median | 66.8% | 44.2% |
| Interquartile 25% (IQ1) | 52.0% | 30.5% |
| Interquartile 75% (IQ3) | 71.5% | 49.5% |
| Interquartile Range (IQR) | 19.5% | 19.0% |
| Standard Deviation (Sample) | 13.0% | 12.7% |
| Standard Deviation (Population) | 12.7% | 12.6% |
Similar Demographics by College, 1 year or more
Demographics Similar to Immigrants from Turkey by College, 1 year or more
In terms of college, 1 year or more, the demographic groups most similar to Immigrants from Turkey are Immigrants from South Africa (65.1%, a difference of 0.080%), Russian (65.1%, a difference of 0.090%), Israeli (65.3%, a difference of 0.20%), Immigrants from Saudi Arabia (65.0%, a difference of 0.24%), and Estonian (65.0%, a difference of 0.31%).
| Demographics | Rating | Rank | College, 1 year or more |
| Immigrants | France | 100.0 /100 | #28 | Exceptional 65.8% |
| Immigrants | Northern Europe | 100.0 /100 | #29 | Exceptional 65.6% |
| Immigrants | Denmark | 100.0 /100 | #30 | Exceptional 65.6% |
| Turks | 100.0 /100 | #31 | Exceptional 65.5% |
| Bulgarians | 100.0 /100 | #32 | Exceptional 65.5% |
| Immigrants | Sri Lanka | 99.9 /100 | #33 | Exceptional 65.4% |
| Israelis | 99.9 /100 | #34 | Exceptional 65.3% |
| Immigrants | Turkey | 99.9 /100 | #35 | Exceptional 65.2% |
| Immigrants | South Africa | 99.9 /100 | #36 | Exceptional 65.1% |
| Russians | 99.9 /100 | #37 | Exceptional 65.1% |
| Immigrants | Saudi Arabia | 99.9 /100 | #38 | Exceptional 65.0% |
| Estonians | 99.9 /100 | #39 | Exceptional 65.0% |
| Immigrants | Kuwait | 99.9 /100 | #40 | Exceptional 65.0% |
| Mongolians | 99.9 /100 | #41 | Exceptional 64.8% |
| Immigrants | Latvia | 99.9 /100 | #42 | Exceptional 64.8% |
Demographics Similar to Immigrants from Yemen by College, 1 year or more
In terms of college, 1 year or more, the demographic groups most similar to Immigrants from Yemen are Native/Alaskan (50.2%, a difference of 0.35%), Cape Verdean (50.3%, a difference of 0.57%), Dutch West Indian (50.5%, a difference of 0.97%), Menominee (50.6%, a difference of 1.1%), and Dominican (50.6%, a difference of 1.1%).
| Demographics | Rating | Rank | College, 1 year or more |
| Immigrants | Cuba | 0.0 /100 | #324 | Tragic 50.7% |
| Immigrants | Latin America | 0.0 /100 | #325 | Tragic 50.7% |
| Dominicans | 0.0 /100 | #326 | Tragic 50.6% |
| Menominee | 0.0 /100 | #327 | Tragic 50.6% |
| Dutch West Indians | 0.0 /100 | #328 | Tragic 50.5% |
| Cape Verdeans | 0.0 /100 | #329 | Tragic 50.3% |
| Natives/Alaskans | 0.0 /100 | #330 | Tragic 50.2% |
| Immigrants | Yemen | 0.0 /100 | #331 | Tragic 50.0% |
| Mexicans | 0.0 /100 | #332 | Tragic 49.2% |
| Immigrants | Dominican Republic | 0.0 /100 | #333 | Tragic 49.1% |
| Lumbee | 0.0 /100 | #334 | Tragic 48.9% |
| Yuman | 0.0 /100 | #335 | Tragic 48.7% |
| Spanish American Indians | 0.0 /100 | #336 | Tragic 48.5% |
| Pennsylvania Germans | 0.0 /100 | #337 | Tragic 48.5% |
| Immigrants | Central America | 0.0 /100 | #338 | Tragic 48.5% |