Immigrants from Turkey vs Immigrants from Iran High School Diploma
COMPARE
Immigrants from Turkey
Immigrants from Iran
High School Diploma
High School Diploma Comparison
Immigrants from Turkey
Immigrants from Iran
90.6%
HIGH SCHOOL DIPLOMA
98.9/ 100
METRIC RATING
87th/ 347
METRIC RANK
90.9%
HIGH SCHOOL DIPLOMA
99.5/ 100
METRIC RATING
67th/ 347
METRIC RANK
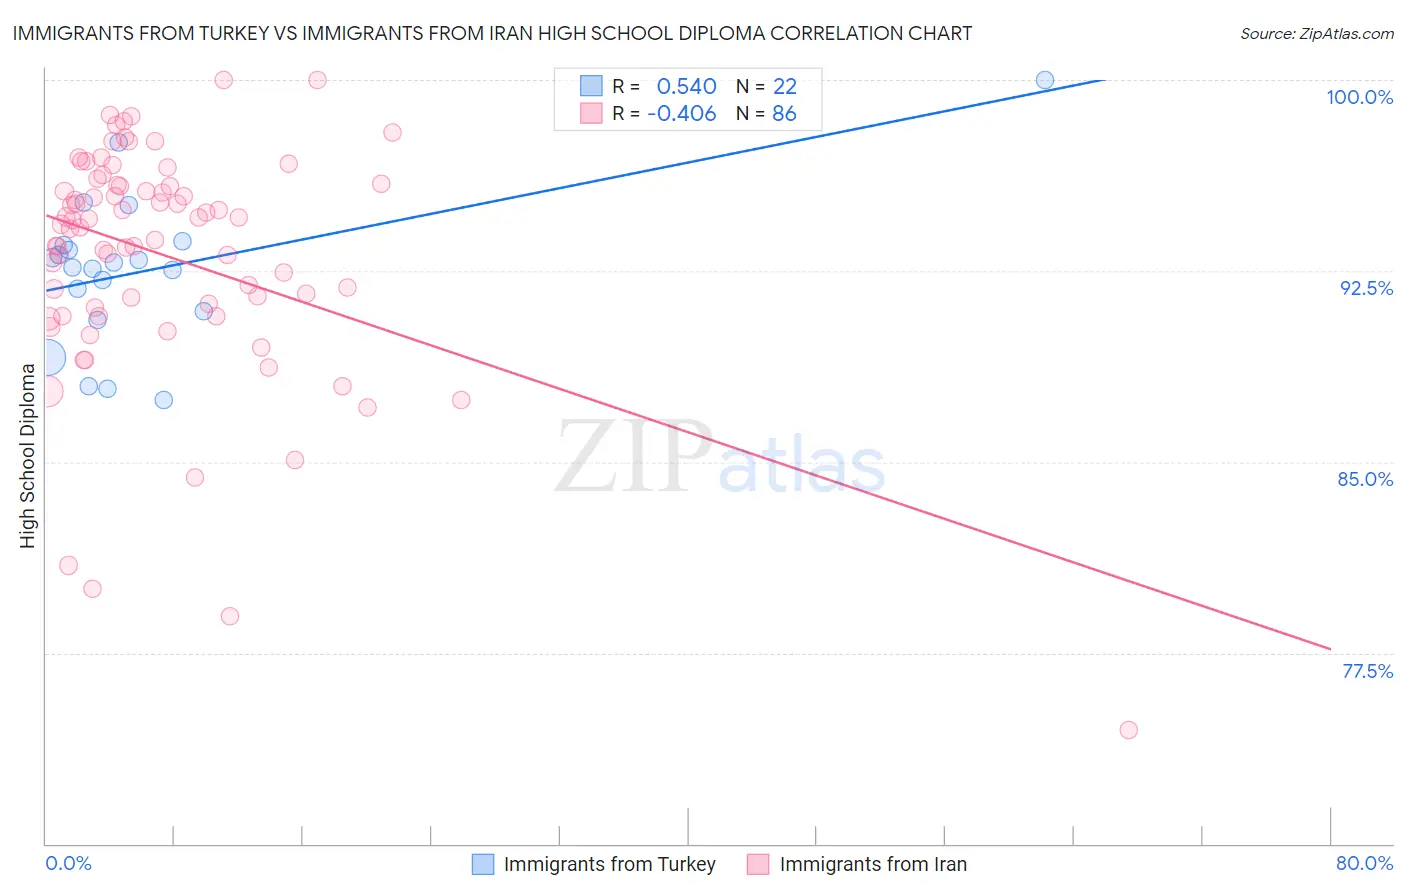
Immigrants from Turkey vs Immigrants from Iran High School Diploma Correlation Chart
The statistical analysis conducted on geographies consisting of 223,057,877 people shows a substantial positive correlation between the proportion of Immigrants from Turkey and percentage of population with at least high school diploma education in the United States with a correlation coefficient (R) of 0.540 and weighted average of 90.6%. Similarly, the statistical analysis conducted on geographies consisting of 279,904,902 people shows a moderate negative correlation between the proportion of Immigrants from Iran and percentage of population with at least high school diploma education in the United States with a correlation coefficient (R) of -0.406 and weighted average of 90.9%, a difference of 0.32%.
High School Diploma Correlation Summary
| Measurement | Immigrants from Turkey | Immigrants from Iran |
| Minimum | 87.4% | 74.5% |
| Maximum | 100.0% | 100.0% |
| Range | 12.6% | 25.5% |
| Mean | 92.5% | 93.1% |
| Median | 92.7% | 94.4% |
| Interquartile 25% (IQ1) | 90.9% | 91.1% |
| Interquartile 75% (IQ3) | 93.5% | 95.9% |
| Interquartile Range (IQR) | 2.6% | 4.8% |
| Standard Deviation (Sample) | 3.0% | 4.6% |
| Standard Deviation (Population) | 2.9% | 4.6% |
Demographics Similar to Immigrants from Turkey and Immigrants from Iran by High School Diploma
In terms of high school diploma, the demographic groups most similar to Immigrants from Turkey are Immigrants from Bulgaria (90.6%, a difference of 0.0%), Romanian (90.7%, a difference of 0.010%), Immigrants from Saudi Arabia (90.7%, a difference of 0.090%), Immigrants from Moldova (90.7%, a difference of 0.12%), and Scotch-Irish (90.8%, a difference of 0.14%). Similarly, the demographic groups most similar to Immigrants from Iran are Czechoslovakian (90.9%, a difference of 0.010%), French Canadian (90.9%, a difference of 0.040%), Immigrants from Latvia (90.9%, a difference of 0.050%), Alaskan Athabascan (90.9%, a difference of 0.050%), and Soviet Union (90.9%, a difference of 0.050%).
| Demographics | Rating | Rank | High School Diploma |
| Immigrants | Iran | 99.5 /100 | #67 | Exceptional 90.9% |
| Czechoslovakians | 99.5 /100 | #68 | Exceptional 90.9% |
| French Canadians | 99.5 /100 | #69 | Exceptional 90.9% |
| Immigrants | Latvia | 99.5 /100 | #70 | Exceptional 90.9% |
| Alaskan Athabascans | 99.4 /100 | #71 | Exceptional 90.9% |
| Soviet Union | 99.4 /100 | #72 | Exceptional 90.9% |
| Immigrants | South Central Asia | 99.4 /100 | #73 | Exceptional 90.9% |
| Immigrants | Czechoslovakia | 99.4 /100 | #74 | Exceptional 90.9% |
| Cambodians | 99.4 /100 | #75 | Exceptional 90.8% |
| Hungarians | 99.3 /100 | #76 | Exceptional 90.8% |
| Native Hawaiians | 99.3 /100 | #77 | Exceptional 90.8% |
| Burmese | 99.3 /100 | #78 | Exceptional 90.8% |
| Immigrants | Denmark | 99.3 /100 | #79 | Exceptional 90.8% |
| Immigrants | England | 99.3 /100 | #80 | Exceptional 90.8% |
| Immigrants | Switzerland | 99.3 /100 | #81 | Exceptional 90.8% |
| Scotch-Irish | 99.2 /100 | #82 | Exceptional 90.8% |
| Immigrants | Moldova | 99.2 /100 | #83 | Exceptional 90.7% |
| Immigrants | Saudi Arabia | 99.1 /100 | #84 | Exceptional 90.7% |
| Romanians | 98.9 /100 | #85 | Exceptional 90.7% |
| Immigrants | Bulgaria | 98.9 /100 | #86 | Exceptional 90.6% |
| Immigrants | Turkey | 98.9 /100 | #87 | Exceptional 90.6% |