Immigrants from Turkey vs Spanish College, 1 year or more
COMPARE
Immigrants from Turkey
Spanish
College, 1 year or more
College, 1 year or more Comparison
Immigrants from Turkey
Spanish
65.2%
COLLEGE, 1 YEAR OR MORE
99.9/ 100
METRIC RATING
35th/ 347
METRIC RANK
58.5%
COLLEGE, 1 YEAR OR MORE
24.2/ 100
METRIC RATING
200th/ 347
METRIC RANK
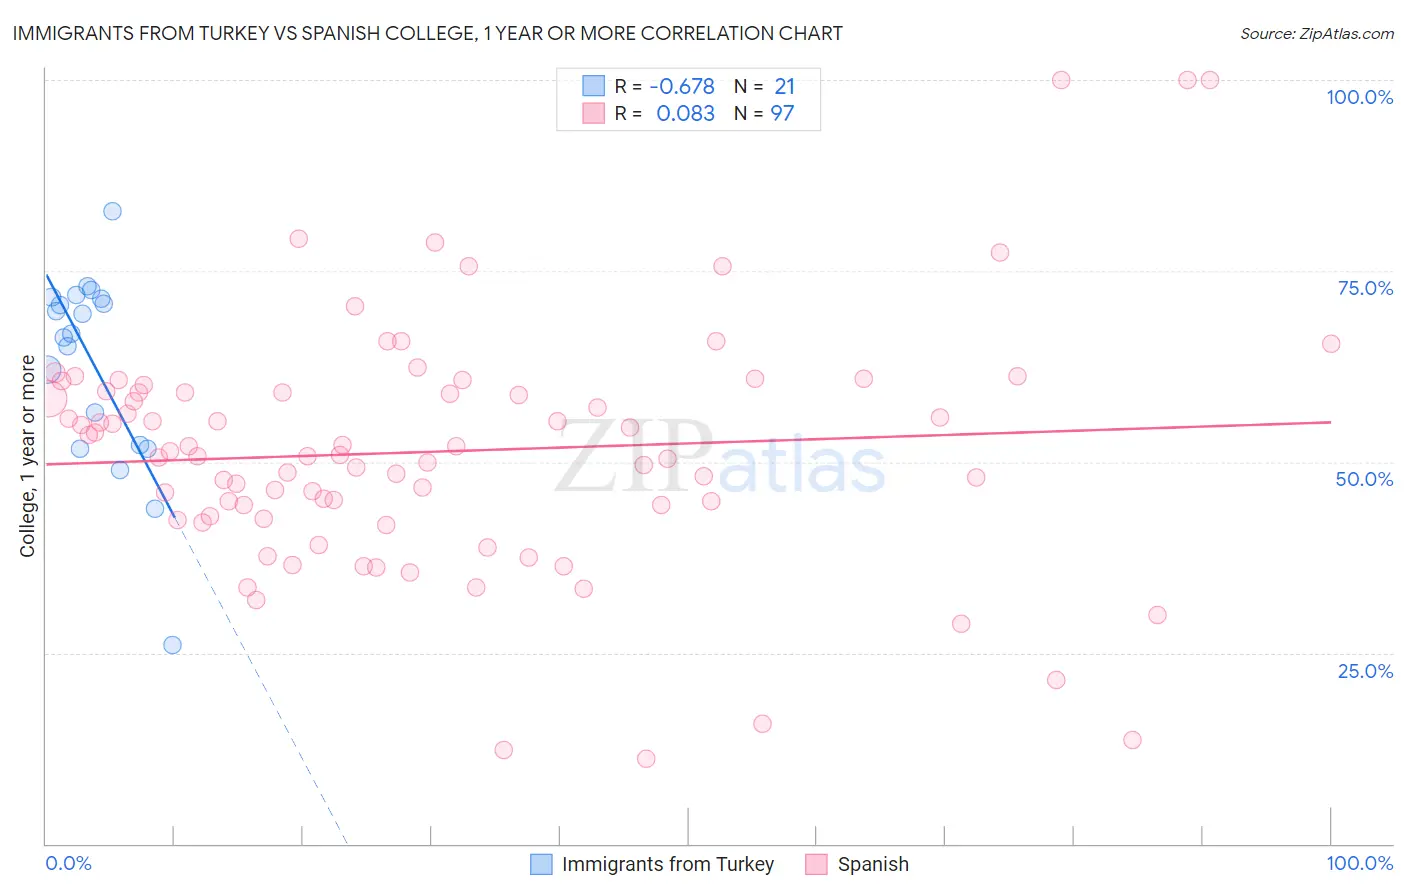
Immigrants from Turkey vs Spanish College, 1 year or more Correlation Chart
The statistical analysis conducted on geographies consisting of 223,057,840 people shows a significant negative correlation between the proportion of Immigrants from Turkey and percentage of population with at least college, 1 year or more education in the United States with a correlation coefficient (R) of -0.678 and weighted average of 65.2%. Similarly, the statistical analysis conducted on geographies consisting of 422,188,641 people shows a slight positive correlation between the proportion of Spanish and percentage of population with at least college, 1 year or more education in the United States with a correlation coefficient (R) of 0.083 and weighted average of 58.5%, a difference of 11.4%.
College, 1 year or more Correlation Summary
| Measurement | Immigrants from Turkey | Spanish |
| Minimum | 26.0% | 11.1% |
| Maximum | 82.8% | 100.0% |
| Range | 56.8% | 88.9% |
| Mean | 62.6% | 51.3% |
| Median | 66.8% | 50.8% |
| Interquartile 25% (IQ1) | 52.0% | 42.7% |
| Interquartile 75% (IQ3) | 71.5% | 59.2% |
| Interquartile Range (IQR) | 19.5% | 16.5% |
| Standard Deviation (Sample) | 13.0% | 16.1% |
| Standard Deviation (Population) | 12.7% | 16.1% |
Similar Demographics by College, 1 year or more
Demographics Similar to Immigrants from Turkey by College, 1 year or more
In terms of college, 1 year or more, the demographic groups most similar to Immigrants from Turkey are Immigrants from South Africa (65.1%, a difference of 0.080%), Russian (65.1%, a difference of 0.090%), Israeli (65.3%, a difference of 0.20%), Immigrants from Saudi Arabia (65.0%, a difference of 0.24%), and Estonian (65.0%, a difference of 0.31%).
| Demographics | Rating | Rank | College, 1 year or more |
| Immigrants | France | 100.0 /100 | #28 | Exceptional 65.8% |
| Immigrants | Northern Europe | 100.0 /100 | #29 | Exceptional 65.6% |
| Immigrants | Denmark | 100.0 /100 | #30 | Exceptional 65.6% |
| Turks | 100.0 /100 | #31 | Exceptional 65.5% |
| Bulgarians | 100.0 /100 | #32 | Exceptional 65.5% |
| Immigrants | Sri Lanka | 99.9 /100 | #33 | Exceptional 65.4% |
| Israelis | 99.9 /100 | #34 | Exceptional 65.3% |
| Immigrants | Turkey | 99.9 /100 | #35 | Exceptional 65.2% |
| Immigrants | South Africa | 99.9 /100 | #36 | Exceptional 65.1% |
| Russians | 99.9 /100 | #37 | Exceptional 65.1% |
| Immigrants | Saudi Arabia | 99.9 /100 | #38 | Exceptional 65.0% |
| Estonians | 99.9 /100 | #39 | Exceptional 65.0% |
| Immigrants | Kuwait | 99.9 /100 | #40 | Exceptional 65.0% |
| Mongolians | 99.9 /100 | #41 | Exceptional 64.8% |
| Immigrants | Latvia | 99.9 /100 | #42 | Exceptional 64.8% |
Demographics Similar to Spanish by College, 1 year or more
In terms of college, 1 year or more, the demographic groups most similar to Spanish are Slovak (58.5%, a difference of 0.030%), Immigrants from South Eastern Asia (58.5%, a difference of 0.070%), Nigerian (58.5%, a difference of 0.090%), Immigrants from Thailand (58.6%, a difference of 0.13%), and Dutch (58.6%, a difference of 0.14%).
| Demographics | Rating | Rank | College, 1 year or more |
| Peruvians | 27.5 /100 | #193 | Fair 58.6% |
| Costa Ricans | 26.4 /100 | #194 | Fair 58.6% |
| Dutch | 26.2 /100 | #195 | Fair 58.6% |
| Guamanians/Chamorros | 26.2 /100 | #196 | Fair 58.6% |
| Immigrants | Thailand | 26.0 /100 | #197 | Fair 58.6% |
| Immigrants | South Eastern Asia | 25.1 /100 | #198 | Fair 58.5% |
| Slovaks | 24.6 /100 | #199 | Fair 58.5% |
| Spanish | 24.2 /100 | #200 | Fair 58.5% |
| Nigerians | 23.0 /100 | #201 | Fair 58.5% |
| Immigrants | South America | 21.9 /100 | #202 | Fair 58.4% |
| Ghanaians | 20.9 /100 | #203 | Fair 58.4% |
| Panamanians | 19.2 /100 | #204 | Poor 58.3% |
| Immigrants | Zaire | 18.7 /100 | #205 | Poor 58.3% |
| Immigrants | Vietnam | 18.2 /100 | #206 | Poor 58.2% |
| Senegalese | 16.9 /100 | #207 | Poor 58.2% |