Immigrants from Turkey vs Romanian College, 1 year or more
COMPARE
Immigrants from Turkey
Romanian
College, 1 year or more
College, 1 year or more Comparison
Immigrants from Turkey
Romanians
65.2%
COLLEGE, 1 YEAR OR MORE
99.9/ 100
METRIC RATING
35th/ 347
METRIC RANK
62.4%
COLLEGE, 1 YEAR OR MORE
97.7/ 100
METRIC RATING
93rd/ 347
METRIC RANK
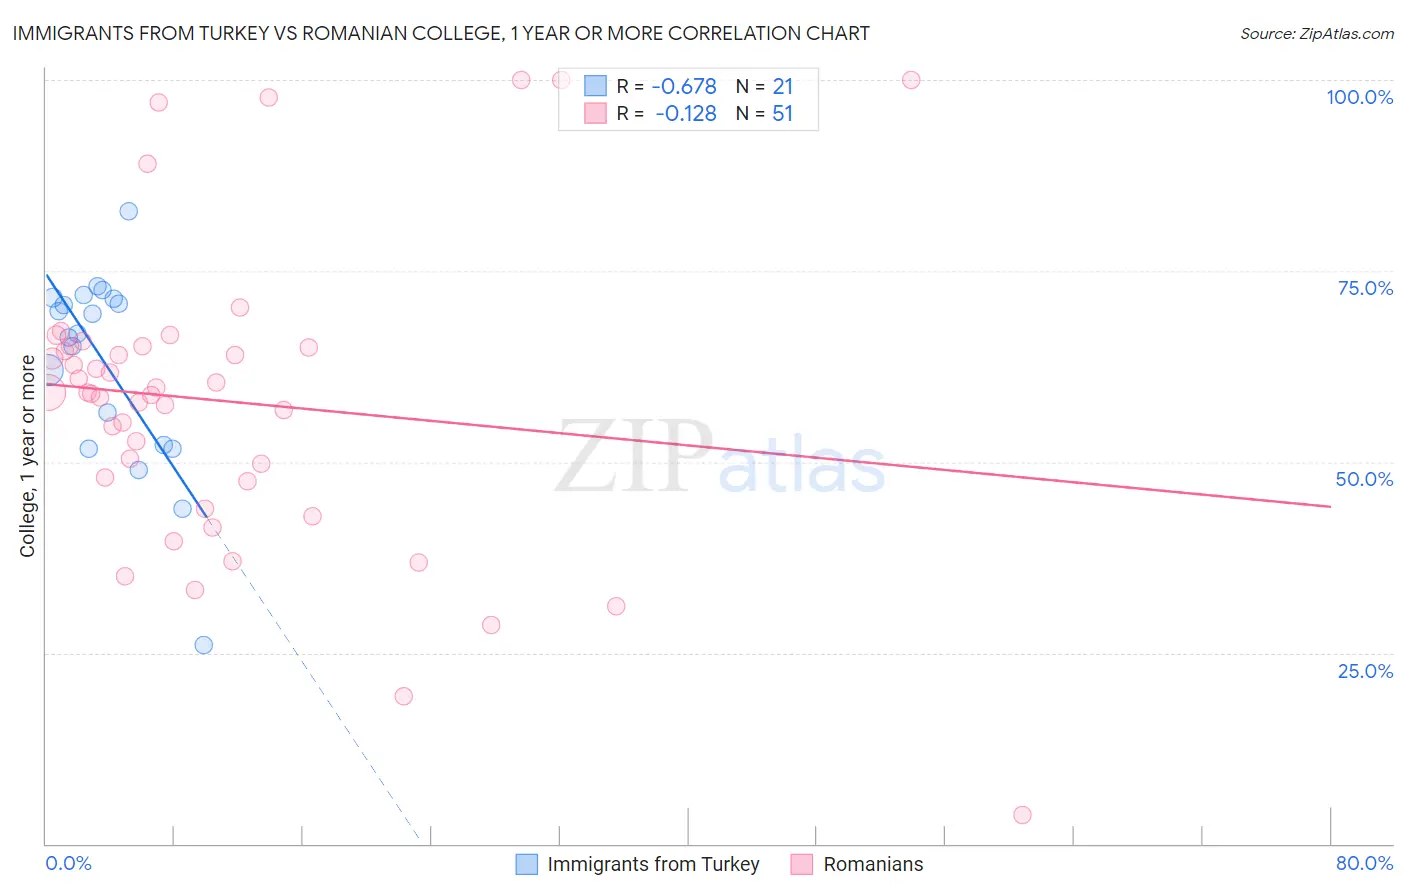
Immigrants from Turkey vs Romanian College, 1 year or more Correlation Chart
The statistical analysis conducted on geographies consisting of 223,057,840 people shows a significant negative correlation between the proportion of Immigrants from Turkey and percentage of population with at least college, 1 year or more education in the United States with a correlation coefficient (R) of -0.678 and weighted average of 65.2%. Similarly, the statistical analysis conducted on geographies consisting of 377,903,335 people shows a poor negative correlation between the proportion of Romanians and percentage of population with at least college, 1 year or more education in the United States with a correlation coefficient (R) of -0.128 and weighted average of 62.4%, a difference of 4.5%.
College, 1 year or more Correlation Summary
| Measurement | Immigrants from Turkey | Romanian |
| Minimum | 26.0% | 3.8% |
| Maximum | 82.8% | 100.0% |
| Range | 56.8% | 96.2% |
| Mean | 62.6% | 58.0% |
| Median | 66.8% | 59.0% |
| Interquartile 25% (IQ1) | 52.0% | 47.5% |
| Interquartile 75% (IQ3) | 71.5% | 65.1% |
| Interquartile Range (IQR) | 19.5% | 17.6% |
| Standard Deviation (Sample) | 13.0% | 19.8% |
| Standard Deviation (Population) | 12.7% | 19.6% |
Similar Demographics by College, 1 year or more
Demographics Similar to Immigrants from Turkey by College, 1 year or more
In terms of college, 1 year or more, the demographic groups most similar to Immigrants from Turkey are Immigrants from South Africa (65.1%, a difference of 0.080%), Russian (65.1%, a difference of 0.090%), Israeli (65.3%, a difference of 0.20%), Immigrants from Saudi Arabia (65.0%, a difference of 0.24%), and Estonian (65.0%, a difference of 0.31%).
| Demographics | Rating | Rank | College, 1 year or more |
| Immigrants | France | 100.0 /100 | #28 | Exceptional 65.8% |
| Immigrants | Northern Europe | 100.0 /100 | #29 | Exceptional 65.6% |
| Immigrants | Denmark | 100.0 /100 | #30 | Exceptional 65.6% |
| Turks | 100.0 /100 | #31 | Exceptional 65.5% |
| Bulgarians | 100.0 /100 | #32 | Exceptional 65.5% |
| Immigrants | Sri Lanka | 99.9 /100 | #33 | Exceptional 65.4% |
| Israelis | 99.9 /100 | #34 | Exceptional 65.3% |
| Immigrants | Turkey | 99.9 /100 | #35 | Exceptional 65.2% |
| Immigrants | South Africa | 99.9 /100 | #36 | Exceptional 65.1% |
| Russians | 99.9 /100 | #37 | Exceptional 65.1% |
| Immigrants | Saudi Arabia | 99.9 /100 | #38 | Exceptional 65.0% |
| Estonians | 99.9 /100 | #39 | Exceptional 65.0% |
| Immigrants | Kuwait | 99.9 /100 | #40 | Exceptional 65.0% |
| Mongolians | 99.9 /100 | #41 | Exceptional 64.8% |
| Immigrants | Latvia | 99.9 /100 | #42 | Exceptional 64.8% |
Demographics Similar to Romanians by College, 1 year or more
In terms of college, 1 year or more, the demographic groups most similar to Romanians are Immigrants from Egypt (62.4%, a difference of 0.030%), Immigrants from Eastern Europe (62.4%, a difference of 0.040%), Immigrants from Croatia (62.3%, a difference of 0.060%), Immigrants from Western Asia (62.5%, a difference of 0.14%), and British (62.3%, a difference of 0.16%).
| Demographics | Rating | Rank | College, 1 year or more |
| Immigrants | Western Europe | 98.6 /100 | #86 | Exceptional 62.7% |
| Immigrants | Hungary | 98.6 /100 | #87 | Exceptional 62.7% |
| Greeks | 98.3 /100 | #88 | Exceptional 62.6% |
| Immigrants | Ethiopia | 98.2 /100 | #89 | Exceptional 62.6% |
| Immigrants | Western Asia | 97.9 /100 | #90 | Exceptional 62.5% |
| Immigrants | Eastern Europe | 97.8 /100 | #91 | Exceptional 62.4% |
| Immigrants | Egypt | 97.8 /100 | #92 | Exceptional 62.4% |
| Romanians | 97.7 /100 | #93 | Exceptional 62.4% |
| Immigrants | Croatia | 97.6 /100 | #94 | Exceptional 62.3% |
| British | 97.4 /100 | #95 | Exceptional 62.3% |
| Chinese | 97.2 /100 | #96 | Exceptional 62.2% |
| Jordanians | 97.2 /100 | #97 | Exceptional 62.2% |
| Carpatho Rusyns | 97.2 /100 | #98 | Exceptional 62.2% |
| Croatians | 97.1 /100 | #99 | Exceptional 62.2% |
| Icelanders | 96.8 /100 | #100 | Exceptional 62.1% |