Immigrants from Thailand vs Choctaw Master's Degree
COMPARE
Immigrants from Thailand
Choctaw
Master's Degree
Master's Degree Comparison
Immigrants from Thailand
Choctaw
14.2%
MASTER'S DEGREE
17.0/ 100
METRIC RATING
213th/ 347
METRIC RANK
11.0%
MASTER'S DEGREE
0.0/ 100
METRIC RATING
312th/ 347
METRIC RANK
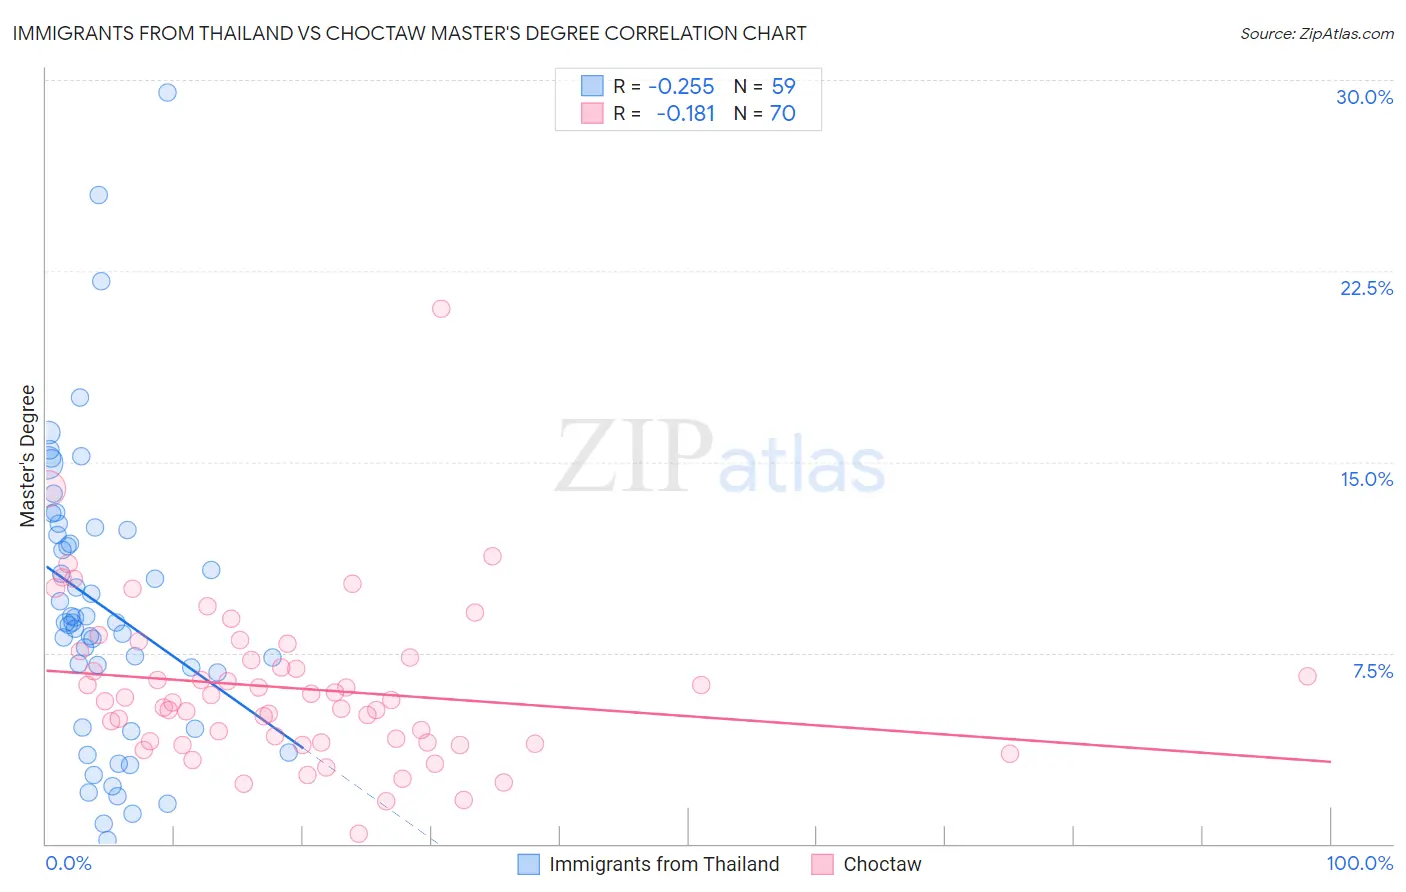
Immigrants from Thailand vs Choctaw Master's Degree Correlation Chart
The statistical analysis conducted on geographies consisting of 316,948,216 people shows a weak negative correlation between the proportion of Immigrants from Thailand and percentage of population with at least master's degree education in the United States with a correlation coefficient (R) of -0.255 and weighted average of 14.2%. Similarly, the statistical analysis conducted on geographies consisting of 269,630,236 people shows a poor negative correlation between the proportion of Choctaw and percentage of population with at least master's degree education in the United States with a correlation coefficient (R) of -0.181 and weighted average of 11.0%, a difference of 28.4%.
Master's Degree Correlation Summary
| Measurement | Immigrants from Thailand | Choctaw |
| Minimum | 0.16% | 0.41% |
| Maximum | 29.5% | 21.0% |
| Range | 29.4% | 20.6% |
| Mean | 9.3% | 6.1% |
| Median | 8.7% | 5.6% |
| Interquartile 25% (IQ1) | 4.5% | 4.0% |
| Interquartile 75% (IQ3) | 12.3% | 7.3% |
| Interquartile Range (IQR) | 7.8% | 3.3% |
| Standard Deviation (Sample) | 5.8% | 3.2% |
| Standard Deviation (Population) | 5.7% | 3.1% |
Similar Demographics by Master's Degree
Demographics Similar to Immigrants from Thailand by Master's Degree
In terms of master's degree, the demographic groups most similar to Immigrants from Thailand are Finnish (14.2%, a difference of 0.010%), Spanish (14.2%, a difference of 0.19%), Immigrants from Vietnam (14.1%, a difference of 0.22%), Somali (14.2%, a difference of 0.24%), and Immigrants from Somalia (14.1%, a difference of 0.29%).
| Demographics | Rating | Rank | Master's Degree |
| Scandinavians | 23.3 /100 | #206 | Fair 14.4% |
| Immigrants | Bosnia and Herzegovina | 22.0 /100 | #207 | Fair 14.3% |
| Immigrants | Barbados | 20.5 /100 | #208 | Fair 14.3% |
| Immigrants | Panama | 20.0 /100 | #209 | Fair 14.3% |
| Sub-Saharan Africans | 19.4 /100 | #210 | Poor 14.2% |
| Somalis | 18.0 /100 | #211 | Poor 14.2% |
| Spanish | 17.8 /100 | #212 | Poor 14.2% |
| Immigrants | Thailand | 17.0 /100 | #213 | Poor 14.2% |
| Finns | 16.9 /100 | #214 | Poor 14.2% |
| Immigrants | Vietnam | 16.1 /100 | #215 | Poor 14.1% |
| Immigrants | Somalia | 15.8 /100 | #216 | Poor 14.1% |
| Immigrants | Trinidad and Tobago | 15.8 /100 | #217 | Poor 14.1% |
| French Canadians | 14.9 /100 | #218 | Poor 14.1% |
| Norwegians | 13.6 /100 | #219 | Poor 14.0% |
| Germans | 13.1 /100 | #220 | Poor 14.0% |
Demographics Similar to Choctaw by Master's Degree
In terms of master's degree, the demographic groups most similar to Choctaw are Seminole (11.0%, a difference of 0.10%), Yaqui (11.0%, a difference of 0.18%), Cajun (11.0%, a difference of 0.57%), Apache (11.0%, a difference of 0.58%), and Shoshone (11.1%, a difference of 0.61%).
| Demographics | Rating | Rank | Master's Degree |
| Immigrants | Latin America | 0.0 /100 | #305 | Tragic 11.3% |
| Mexican American Indians | 0.0 /100 | #306 | Tragic 11.2% |
| Cheyenne | 0.0 /100 | #307 | Tragic 11.2% |
| Puerto Ricans | 0.0 /100 | #308 | Tragic 11.2% |
| Puget Sound Salish | 0.0 /100 | #309 | Tragic 11.1% |
| Shoshone | 0.0 /100 | #310 | Tragic 11.1% |
| Seminole | 0.0 /100 | #311 | Tragic 11.0% |
| Choctaw | 0.0 /100 | #312 | Tragic 11.0% |
| Yaqui | 0.0 /100 | #313 | Tragic 11.0% |
| Cajuns | 0.0 /100 | #314 | Tragic 11.0% |
| Apache | 0.0 /100 | #315 | Tragic 11.0% |
| Hispanics or Latinos | 0.0 /100 | #316 | Tragic 10.9% |
| Hopi | 0.0 /100 | #317 | Tragic 10.9% |
| Immigrants | Cuba | 0.0 /100 | #318 | Tragic 10.9% |
| Kiowa | 0.0 /100 | #319 | Tragic 10.8% |